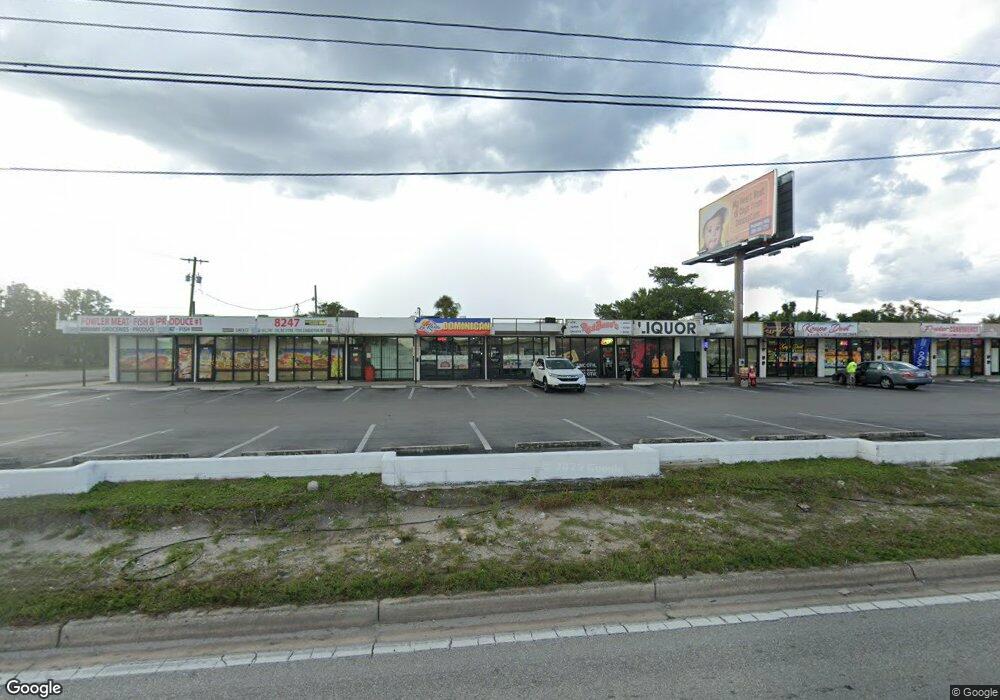
2620 Fowler St Fort Myers, FL 33901
Estimated Value: $1,424,674
--
Bed
30
Baths
12,319
Sq Ft
$116/Sq Ft
Est. Value
About This Home
This home is located at 2620 Fowler St, Fort Myers, FL 33901 and is currently estimated at $1,424,674, approximately $115 per square foot. 2620 Fowler St is a home located in Lee County with nearby schools including Edison Park Creative & Expressive Arts School, Allen Park Elementary School, and Orangewood Elementary School.
Ownership History
Date
Name
Owned For
Owner Type
Purchase Details
Closed on
Mar 2, 2020
Sold by
Downtown Capital Assets Llc
Bought by
Midtown Business Center Llc
Current Estimated Value
Purchase Details
Closed on
May 15, 2017
Sold by
Sunshine Park Investments Llc
Bought by
Downtown Capital Asset Llc
Home Financials for this Owner
Home Financials are based on the most recent Mortgage that was taken out on this home.
Original Mortgage
$850,000
Interest Rate
4.08%
Mortgage Type
Commercial
Purchase Details
Closed on
Aug 21, 2013
Sold by
Coen Sophia P
Bought by
Sunshine Park Investments Llc
Home Financials for this Owner
Home Financials are based on the most recent Mortgage that was taken out on this home.
Original Mortgage
$200,000
Interest Rate
4.39%
Mortgage Type
Commercial
Create a Home Valuation Report for This Property
The Home Valuation Report is an in-depth analysis detailing your home's value as well as a comparison with similar homes in the area
Home Values in the Area
Average Home Value in this Area
Purchase History
| Date | Buyer | Sale Price | Title Company |
|---|---|---|---|
| Midtown Business Center Llc | -- | Accommodation | |
| Downtown Capital Asset Llc | -- | Old Florida Title | |
| Sunshine Park Investments Llc | $550,000 | Ross Title & Escrow Inc |
Source: Public Records
Mortgage History
| Date | Status | Borrower | Loan Amount |
|---|---|---|---|
| Previous Owner | Downtown Capital Asset Llc | $850,000 | |
| Previous Owner | Sunshine Park Investments Llc | $200,000 |
Source: Public Records
Tax History Compared to Growth
Tax History
| Year | Tax Paid | Tax Assessment Tax Assessment Total Assessment is a certain percentage of the fair market value that is determined by local assessors to be the total taxable value of land and additions on the property. | Land | Improvement |
|---|---|---|---|---|
| 2025 | $21,086 | $1,046,208 | -- | -- |
| 2024 | $20,237 | $951,098 | $224,474 | $692,572 |
| 2023 | $20,237 | $902,750 | $0 | $0 |
| 2022 | $18,932 | $1,019,649 | $188,789 | $795,049 |
| 2021 | $16,502 | $656,528 | $155,504 | $501,024 |
| 2020 | $14,708 | $633,524 | $130,692 | $502,832 |
| 2019 | $14,099 | $589,430 | $95,344 | $494,086 |
| 2018 | $14,352 | $588,017 | $102,078 | $485,939 |
| 2017 | $12,579 | $499,285 | $83,645 | $415,640 |
| 2016 | $12,529 | $499,320 | $105,585 | $393,735 |
| 2015 | $12,513 | $498,906 | $149,806 | $349,100 |
| 2014 | -- | $447,672 | $134,432 | $313,240 |
| 2013 | -- | $345,334 | $166,748 | $178,586 |
Source: Public Records
Map
Nearby Homes
- 2403 Stella St
- 2428 Stella St
- 2816 Central Ave
- 2269 Katherine St
- 2316 Willard St
- 2828 Jackson St Unit I3
- 2828 Jackson St Unit M5
- 2828 Jackson St Unit C5
- 2828 Jackson St Unit H5
- 2828 Jackson St Unit F-7
- 2828 Jackson St Unit E6
- 2217 Dora St
- 2729 Broadway
- 2403 Maple Ave
- 2941 Powell St
- 2956 Powell St
- 2613 Lafayette St
- 2623 Lafayette St
- 2357 Crawford St
- 2640 Saint Charles St
- 2600 Fowler St
- 2600-2628 Fowler St
- 2578 Fowler St
- 2620 Royal Palm Ave
- 2610 Royal Palm Ave
- 2649 Fowler St
- 2421/2423 Jeffcott St
- 2420/2424 South St
- 2421 Jeffcott St
- 2421 Jeffcott St Unit 2421
- 2646 Royal Palm Ave
- 2405 Jeffcott St
- 2621 Central Ave
- 2403 Jeffcott St
- 2429 South St
- 2617 Central Ave Unit 2617
- 2666 Royal Palm Ave
- 2546 Fowler St
- 2402/2404 South St
- 2601 Fowler St