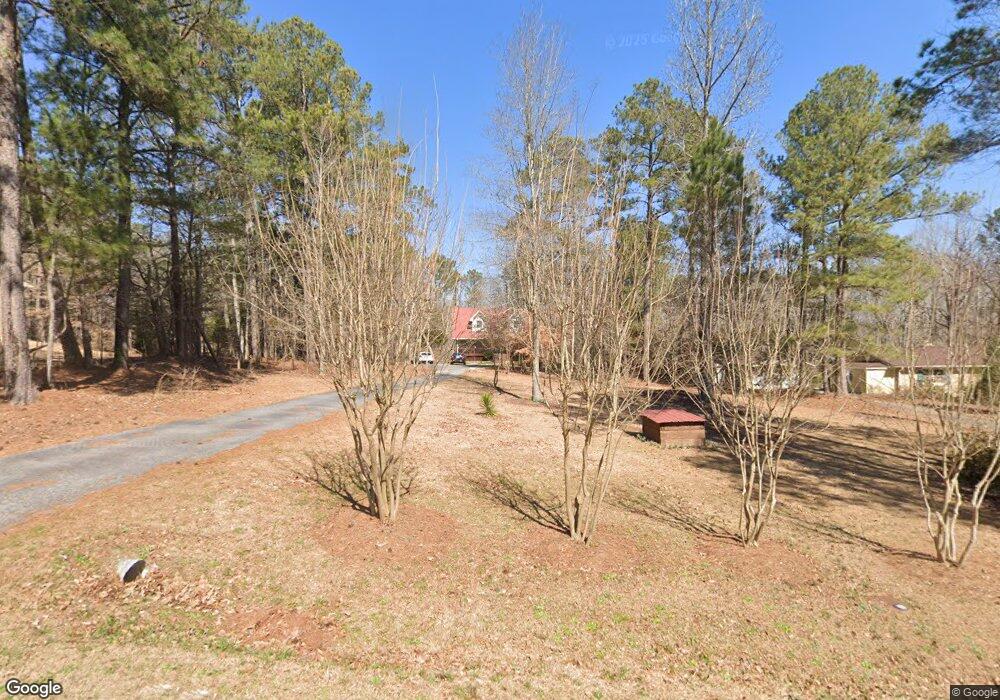
2620 Glendale Dr NE Conyers, GA 30013
Estimated Value: $280,000 - $373,274
3
Beds
3
Baths
2,185
Sq Ft
$142/Sq Ft
Est. Value
About This Home
This home is located at 2620 Glendale Dr NE, Conyers, GA 30013 and is currently estimated at $309,319, approximately $141 per square foot. 2620 Glendale Dr NE is a home located in Rockdale County with nearby schools including Hightower Trail Elementary School, Memorial Middle School, and Salem High School.
Ownership History
Date
Name
Owned For
Owner Type
Purchase Details
Closed on
Oct 26, 2020
Sold by
Rose Andrew
Bought by
Rose Andrew and Rose Charlotte Marie
Current Estimated Value
Home Financials for this Owner
Home Financials are based on the most recent Mortgage that was taken out on this home.
Original Mortgage
$176,900
Outstanding Balance
$156,046
Interest Rate
2.9%
Mortgage Type
New Conventional
Estimated Equity
$153,273
Purchase Details
Closed on
Oct 17, 2018
Sold by
Najarian Capital Llc
Bought by
Rose Andrew
Home Financials for this Owner
Home Financials are based on the most recent Mortgage that was taken out on this home.
Original Mortgage
$166,920
Interest Rate
4.75%
Mortgage Type
FHA
Purchase Details
Closed on
Apr 18, 2018
Sold by
Turner Martha H
Bought by
Najarian Capital Llc
Create a Home Valuation Report for This Property
The Home Valuation Report is an in-depth analysis detailing your home's value as well as a comparison with similar homes in the area
Home Values in the Area
Average Home Value in this Area
Purchase History
| Date | Buyer | Sale Price | Title Company |
|---|---|---|---|
| Rose Andrew | -- | -- | |
| Rose Andrew | $170,000 | -- | |
| Najarian Capital Llc | $75,000 | -- |
Source: Public Records
Mortgage History
| Date | Status | Borrower | Loan Amount |
|---|---|---|---|
| Open | Rose Andrew | $176,900 | |
| Previous Owner | Rose Andrew | $166,920 |
Source: Public Records
Tax History Compared to Growth
Tax History
| Year | Tax Paid | Tax Assessment Tax Assessment Total Assessment is a certain percentage of the fair market value that is determined by local assessors to be the total taxable value of land and additions on the property. | Land | Improvement |
|---|---|---|---|---|
| 2024 | $3,071 | $126,240 | $20,600 | $105,640 |
| 2023 | $4,462 | $109,560 | $23,400 | $86,160 |
| 2022 | $4,118 | $100,880 | $23,600 | $77,280 |
| 2021 | $3,880 | $95,880 | $23,600 | $72,280 |
| 2020 | $2,734 | $64,160 | $6,400 | $57,760 |
| 2019 | $2,880 | $64,160 | $6,400 | $57,760 |
| 2018 | $1,039 | $64,640 | $6,400 | $58,240 |
| 2017 | $105 | $32,320 | $3,600 | $28,720 |
| 2016 | $53 | $29,640 | $3,600 | $26,040 |
| 2015 | $53 | $29,640 | $3,600 | $26,040 |
| 2014 | $9 | $29,640 | $3,600 | $26,040 |
| 2013 | -- | $49,320 | $8,400 | $40,920 |
Source: Public Records
Map
Nearby Homes
- 2615 Glendale Dr NE
- 2545 Pattington Way NE
- 2710 Glendale Dr NE
- 2567 Gees Mill Rd NE
- 360 Glen Rd NE
- 2725 Bailey Place NE
- 2200 Ginger Lake Dr NE
- 1833 Millstone Manor
- 2479 Honey Way
- 2477 Honey Way
- 2553 Riverside Rd
- 2551 Riverside Rd
- 2544 Riverside Rd
- 2516 Riverside Rd
- 2526 Riverside Rd
- 2548 Riverside Rd
- 2260 Ashton Ridge Dr SE
- 1513 Aralynn Ct Unit 3
- 2100 NE Adel Rd
- 1509 Aralynn Way Unit 1
- 2598 Glendale Dr NE
- 2640 Glendale Dr NE
- 2600 Glendale Dr NE
- 2650 Glendale Dr NE
- 2590 Glendale Dr NE
- 2570 Glendale Dr NE
- 2670 Glendale Dr NE
- 2808 Lind Rd NE Unit LOT 26
- 2808 Lind Rd NE
- 2812 Lind Rd NE
- 2595 Glendale Dr NE
- 2645 Glendale Dr NE
- 2573 Pattington Way NE Unit LOT 23
- 2573 Pattington Way NE
- 2713 Ratby Ln NE
- 2710 Ratby Ln NE
- 2560 Glendale Dr NE
- 2665 Glendale Dr NE
- 2565 Glendale Dr NE
- 2804 Lind Rd NE