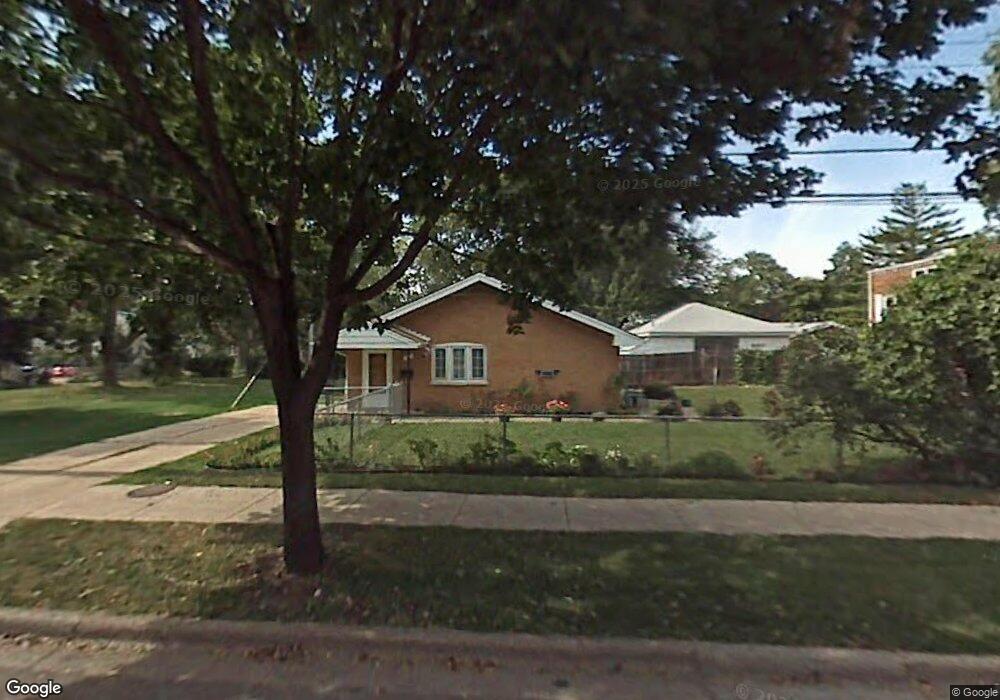
2620 Maple St Des Plaines, IL 60018
Estimated Value: $409,000 - $500,000
3
Beds
1
Bath
1,970
Sq Ft
$225/Sq Ft
Est. Value
About This Home
This home is located at 2620 Maple St, Des Plaines, IL 60018 and is currently estimated at $444,049, approximately $225 per square foot. 2620 Maple St is a home located in Cook County with nearby schools including Orchard Place Elementary School, Algonquin Middle School, and Maine West High School.
Ownership History
Date
Name
Owned For
Owner Type
Purchase Details
Closed on
Jan 4, 2013
Sold by
Lopez Moises Victor
Bought by
Lopez Moises Victor and Sanchez Maria D
Current Estimated Value
Purchase Details
Closed on
Feb 28, 2012
Sold by
Federal Home Loan Mortgage Corporation
Bought by
Lopez Moises Victor
Home Financials for this Owner
Home Financials are based on the most recent Mortgage that was taken out on this home.
Original Mortgage
$89,600
Interest Rate
3.91%
Mortgage Type
New Conventional
Purchase Details
Closed on
Oct 4, 2011
Sold by
Perez Luis
Bought by
Federal Home Loan Mortgage Corporation
Purchase Details
Closed on
Nov 26, 2008
Sold by
Perez Luis and Perez Eliseo
Bought by
Perez Luis
Home Financials for this Owner
Home Financials are based on the most recent Mortgage that was taken out on this home.
Original Mortgage
$225,000
Interest Rate
5.06%
Mortgage Type
New Conventional
Purchase Details
Closed on
Aug 28, 2003
Sold by
Warsi Shabnam
Bought by
Perez Luis and Perez Eliseo
Home Financials for this Owner
Home Financials are based on the most recent Mortgage that was taken out on this home.
Original Mortgage
$233,830
Interest Rate
6.18%
Mortgage Type
FHA
Purchase Details
Closed on
Feb 14, 2001
Sold by
Warsi Syed W
Bought by
Warsi Shabnam A
Home Financials for this Owner
Home Financials are based on the most recent Mortgage that was taken out on this home.
Original Mortgage
$133,000
Interest Rate
6.91%
Purchase Details
Closed on
Mar 24, 2000
Sold by
Merry Terese M and Merry Glen
Bought by
Warsi Syed W and Warsi Shabnam A
Home Financials for this Owner
Home Financials are based on the most recent Mortgage that was taken out on this home.
Original Mortgage
$132,000
Interest Rate
8.39%
Purchase Details
Closed on
Aug 31, 1999
Sold by
Morgan Ronald J and Morgan Gina M
Bought by
Merry Terese M
Home Financials for this Owner
Home Financials are based on the most recent Mortgage that was taken out on this home.
Original Mortgage
$7,990
Interest Rate
7.77%
Mortgage Type
Credit Line Revolving
Purchase Details
Closed on
Sep 30, 1997
Sold by
Reeve Richard A and Keil Reeve Edith
Bought by
Morgan Ronald J and Morgan Gina M
Home Financials for this Owner
Home Financials are based on the most recent Mortgage that was taken out on this home.
Original Mortgage
$127,840
Interest Rate
7.77%
Mortgage Type
Purchase Money Mortgage
Create a Home Valuation Report for This Property
The Home Valuation Report is an in-depth analysis detailing your home's value as well as a comparison with similar homes in the area
Home Values in the Area
Average Home Value in this Area
Purchase History
| Date | Buyer | Sale Price | Title Company |
|---|---|---|---|
| Lopez Moises Victor | -- | Multiple | |
| Lopez Moises Victor | $112,000 | Attorneys Title Guaranty Fun | |
| Federal Home Loan Mortgage Corporation | -- | None Available | |
| Perez Luis | -- | Ticor Title Insurance Co | |
| Perez Luis | $237,500 | Chicago Title Insurance Comp | |
| Warsi Shabnam A | -- | -- | |
| Warsi Syed W | $169,000 | Chicago Title Insurance Co | |
| Merry Terese M | $160,000 | First American Title | |
| Morgan Ronald J | $145,000 | First American Title |
Source: Public Records
Mortgage History
| Date | Status | Borrower | Loan Amount |
|---|---|---|---|
| Previous Owner | Lopez Moises Victor | $89,600 | |
| Previous Owner | Perez Luis | $225,000 | |
| Previous Owner | Perez Luis | $233,830 | |
| Previous Owner | Warsi Shabnam A | $133,000 | |
| Previous Owner | Warsi Syed W | $132,000 | |
| Previous Owner | Morgan Ronald J | $7,990 | |
| Previous Owner | Morgan Ronald J | $127,840 |
Source: Public Records
Tax History Compared to Growth
Tax History
| Year | Tax Paid | Tax Assessment Tax Assessment Total Assessment is a certain percentage of the fair market value that is determined by local assessors to be the total taxable value of land and additions on the property. | Land | Improvement |
|---|---|---|---|---|
| 2024 | $7,299 | $31,000 | $5,550 | $25,450 |
| 2023 | $7,097 | $31,000 | $5,550 | $25,450 |
| 2022 | $7,097 | $31,000 | $5,550 | $25,450 |
| 2021 | $5,940 | $22,656 | $4,625 | $18,031 |
| 2020 | $5,909 | $22,656 | $4,625 | $18,031 |
| 2019 | $5,928 | $25,457 | $4,625 | $20,832 |
| 2018 | $6,161 | $24,036 | $4,070 | $19,966 |
| 2017 | $6,070 | $24,036 | $4,070 | $19,966 |
| 2016 | $5,985 | $24,036 | $4,070 | $19,966 |
| 2015 | $6,482 | $24,064 | $3,515 | $20,549 |
| 2014 | $6,361 | $24,064 | $3,515 | $20,549 |
| 2013 | $6,185 | $24,064 | $3,515 | $20,549 |
Source: Public Records
Map
Nearby Homes
- 2646 Maple St
- 2500 Maple St
- 1757 Farwell Ave
- 2609 Eisenhower Dr
- 1706 Buckingham Dr
- 1966 Laura Ln
- 2600 S Scott St
- 1641 E Touhy Ave
- 1629 E Touhy Ave
- 2126 David Dr
- 2993 Curtis St Unit C41
- 2993 Curtis St
- 2945 S Scott St
- 38 E Touhy Ave
- 3051 S Scott St
- 1928 Kennicott Ct
- 1721 Linden St
- 200 Thames Pkwy Unit 1
- 22 Park Ln Unit 203
- 44 Park Ln Unit 435