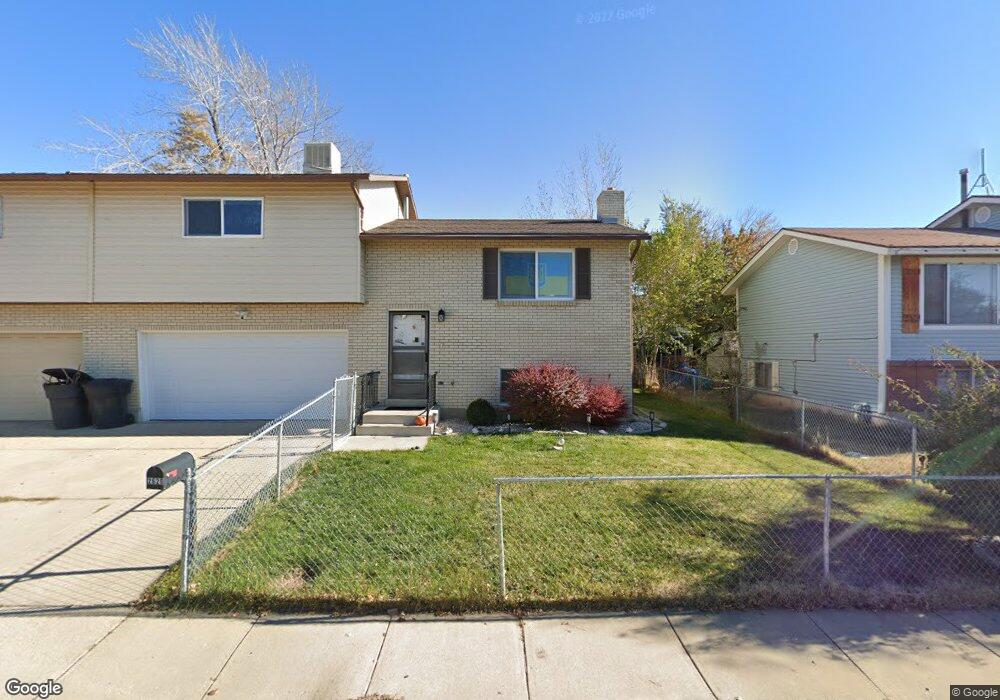
2620 N 140 W Clearfield, UT 84015
Estimated Value: $309,845 - $314,000
2
Beds
1
Bath
1,029
Sq Ft
$303/Sq Ft
Est. Value
About This Home
This home is located at 2620 N 140 W, Clearfield, UT 84015 and is currently estimated at $312,282, approximately $303 per square foot. 2620 N 140 W is a home located in Davis County with nearby schools including Fremont School, Sunset Junior High School, and Northridge High School.
Ownership History
Date
Name
Owned For
Owner Type
Purchase Details
Closed on
Jul 27, 2020
Sold by
Musselman Calvin R
Bought by
Eagle Land Properties Llc
Current Estimated Value
Home Financials for this Owner
Home Financials are based on the most recent Mortgage that was taken out on this home.
Original Mortgage
$164,000
Outstanding Balance
$145,424
Interest Rate
3.1%
Mortgage Type
Credit Line Revolving
Estimated Equity
$166,858
Purchase Details
Closed on
Sep 19, 2013
Sold by
Musselman Calvin R and Musselman Dawnell
Bought by
Eagle Land Properties Llc
Purchase Details
Closed on
Apr 1, 2002
Sold by
Stroheker Cynthia J
Bought by
Mussellman Calvin R and Mussellman Dawnell
Home Financials for this Owner
Home Financials are based on the most recent Mortgage that was taken out on this home.
Original Mortgage
$83,000
Interest Rate
6.84%
Mortgage Type
Seller Take Back
Create a Home Valuation Report for This Property
The Home Valuation Report is an in-depth analysis detailing your home's value as well as a comparison with similar homes in the area
Home Values in the Area
Average Home Value in this Area
Purchase History
| Date | Buyer | Sale Price | Title Company |
|---|---|---|---|
| Eagle Land Properties Llc | -- | Stewart Title Ins | |
| Musselman Calvin R | -- | Stewart Title Insurance | |
| Eagle Land Properties Llc | -- | Mountain View Title | |
| Mussellman Calvin R | -- | Founders Title Co |
Source: Public Records
Mortgage History
| Date | Status | Borrower | Loan Amount |
|---|---|---|---|
| Open | Musselman Calvin R | $164,000 | |
| Previous Owner | Mussellman Calvin R | $83,000 |
Source: Public Records
Tax History Compared to Growth
Tax History
| Year | Tax Paid | Tax Assessment Tax Assessment Total Assessment is a certain percentage of the fair market value that is determined by local assessors to be the total taxable value of land and additions on the property. | Land | Improvement |
|---|---|---|---|---|
| 2025 | $1,737 | $158,400 | $52,164 | $106,236 |
| 2024 | $1,658 | $151,249 | $49,993 | $101,256 |
| 2023 | $1,599 | $146,300 | $44,949 | $101,350 |
| 2022 | $1,643 | $269,000 | $88,364 | $180,636 |
| 2021 | $1,491 | $211,000 | $43,138 | $167,862 |
| 2020 | $1,322 | $184,000 | $34,876 | $149,124 |
| 2019 | $1,212 | $173,000 | $24,000 | $149,000 |
| 2018 | $1,059 | $148,000 | $24,000 | $124,000 |
| 2016 | $870 | $62,480 | $13,200 | $49,280 |
| 2015 | $858 | $58,355 | $13,200 | $45,155 |
| 2014 | $838 | $58,522 | $22,460 | $36,062 |
| 2013 | -- | $51,810 | $23,265 | $28,545 |
Source: Public Records
Map
Nearby Homes
- 2622 N 175 W
- 2622 2125 W
- 2632 2125 W
- 244 W 2575 N
- 350 W 2575 N
- 389 W 2575 N
- 5902 S 1900 W
- 428 W 2650 N
- 2512 N 475 W
- 480 W 2650 N
- 484 W 2650 N
- 2593 N 500 W Unit 56
- 2635 N 500 W Unit 45
- 2612 N 525 W
- 2101 N Main St Unit 205
- 2101 N Main St Unit 409
- 2486 N 690 W
- 2085 N Main St Unit 409
- 2085 N Main St Unit 108
- 2085 N Main St Unit 401