Estimated Value: $289,000 - $357,897
3
Beds
2
Baths
2,112
Sq Ft
$150/Sq Ft
Est. Value
About This Home
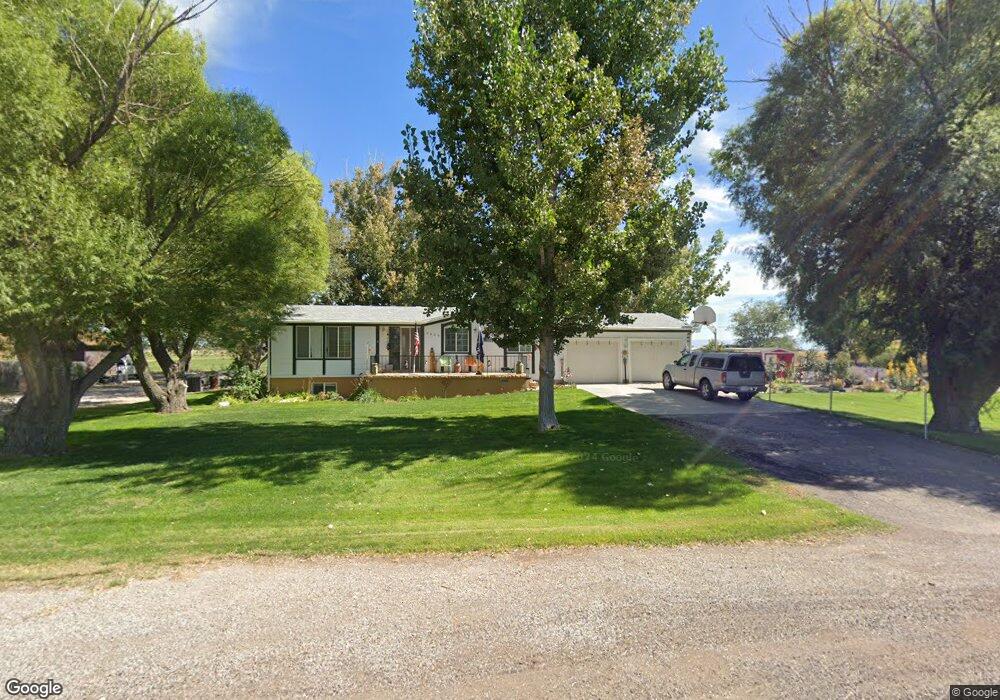
This home is located at 2620 N 3000 W, Delta, UT 84624 and is currently estimated at $317,724, approximately $150 per square foot. 2620 N 3000 W is a home located in Millard County.
Ownership History
Date
Name
Owned For
Owner Type
Purchase Details
Closed on
Sep 20, 2019
Sold by
White Tony L and White Amy Jo
Bought by
Drake Mary Kay and Jermyn Jerome
Current Estimated Value
Purchase Details
Closed on
Jan 28, 2016
Sold by
Cropper Kathleen J and Freeman Rebecca
Bought by
White Tony L and White Amy Jo
Home Financials for this Owner
Home Financials are based on the most recent Mortgage that was taken out on this home.
Original Mortgage
$130,983
Interest Rate
3.99%
Mortgage Type
FHA
Create a Home Valuation Report for This Property
The Home Valuation Report is an in-depth analysis detailing your home's value as well as a comparison with similar homes in the area
Home Values in the Area
Average Home Value in this Area
Purchase History
| Date | Buyer | Sale Price | Title Company |
|---|---|---|---|
| Drake Mary Kay | -- | First American Title | |
| White Tony L | -- | First American Title |
Source: Public Records
Mortgage History
| Date | Status | Borrower | Loan Amount |
|---|---|---|---|
| Previous Owner | White Tony L | $130,983 |
Source: Public Records
Tax History Compared to Growth
Tax History
| Year | Tax Paid | Tax Assessment Tax Assessment Total Assessment is a certain percentage of the fair market value that is determined by local assessors to be the total taxable value of land and additions on the property. | Land | Improvement |
|---|---|---|---|---|
| 2025 | $1,150 | $141,585 | $19,250 | $122,335 |
| 2024 | $1,150 | $157,044 | $13,750 | $143,294 |
| 2023 | $1,285 | $157,044 | $13,750 | $143,294 |
| 2022 | $1,172 | $103,774 | $13,750 | $90,024 |
| 2021 | $920 | $78,615 | $12,100 | $66,515 |
| 2020 | $883 | $76,034 | $12,100 | $63,934 |
| 2019 | $843 | $73,242 | $12,100 | $61,142 |
| 2018 | $673 | $59,980 | $12,100 | $47,880 |
| 2017 | $665 | $56,680 | $8,800 | $47,880 |
| 2016 | $635 | $56,680 | $8,800 | $47,880 |
| 2015 | $635 | $56,680 | $8,800 | $47,880 |
| 2014 | -- | $56,680 | $8,800 | $47,880 |
| 2013 | -- | $50,467 | $8,800 | $41,667 |
Source: Public Records
Map
Nearby Homes
- 9000 W 1500 Rd N
- 4340 W 5000 N
- 98 W 1000 N
- 700 Acres
- 1500 S 10000 W
- 6000 N 10000 W
- 700 Acres Hwy 6 & Main St (Hwy 50)
- 2000 E 10500 N
- 6200 S 3000 W
- 451 W 300 N
- 331 W 200 N
- 325 N 100 W
- 435 W 100 S
- 242 S 400 W
- 163 W 100 S
- 294 S 300 W
- 1025 N Main St
- 901 E 750 Rd N
- 0 E Highway 6 Unit LotWP001 16586023
- 328 S Center St