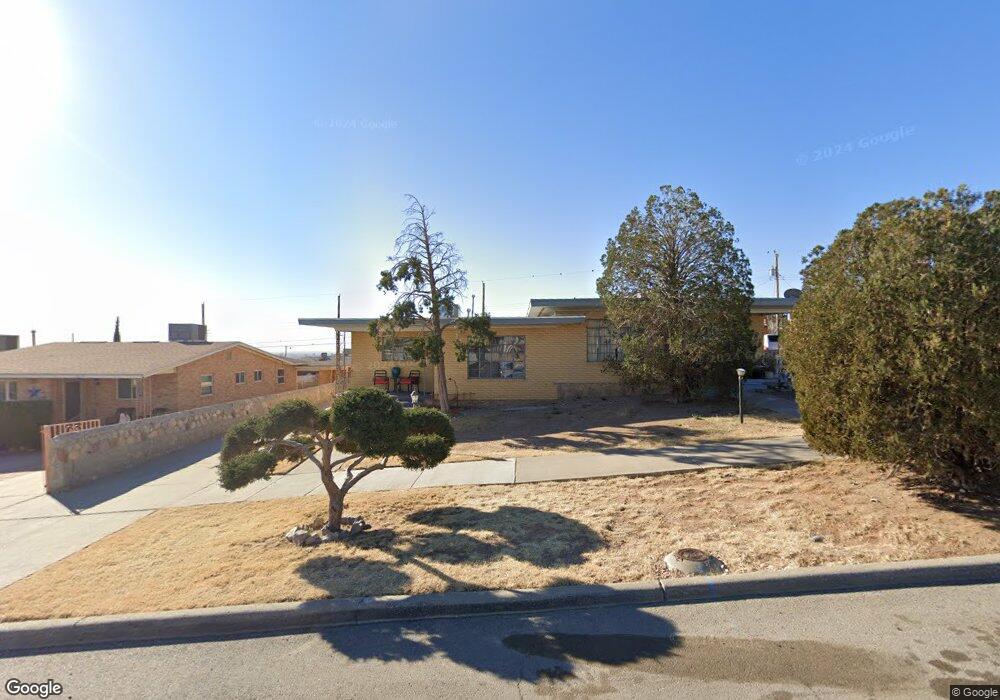
2620 Nashville Ave Unit 2622 El Paso, TX 79930
Grandview NeighborhoodEstimated Value: $199,000 - $356,000
4
Beds
2
Baths
2,038
Sq Ft
$140/Sq Ft
Est. Value
About This Home
This home is located at 2620 Nashville Ave Unit 2622, El Paso, TX 79930 and is currently estimated at $284,478, approximately $139 per square foot. 2620 Nashville Ave Unit 2622 is a home located in El Paso County with nearby schools including Crockett Elementary School, Armendariz Middle School, and Middle School-5 NW Middle.
Ownership History
Date
Name
Owned For
Owner Type
Purchase Details
Closed on
Jul 31, 2006
Sold by
Salome Richard E
Bought by
Ontiveros Richard and Ontiveros Rebecca
Current Estimated Value
Home Financials for this Owner
Home Financials are based on the most recent Mortgage that was taken out on this home.
Original Mortgage
$115,650
Outstanding Balance
$69,510
Interest Rate
6.78%
Mortgage Type
Purchase Money Mortgage
Estimated Equity
$214,968
Purchase Details
Closed on
Sep 7, 2000
Sold by
Helsten Gary Charles
Bought by
Salome Richard E
Purchase Details
Closed on
Sep 6, 2000
Sold by
Helsten Gregory Dean
Bought by
Salome Richard E
Purchase Details
Closed on
Sep 1, 2000
Sold by
Schrom Cindy Lynn
Bought by
Salome Richard E
Purchase Details
Closed on
Aug 29, 2000
Sold by
Salome Richard E
Bought by
Salome Richard E
Create a Home Valuation Report for This Property
The Home Valuation Report is an in-depth analysis detailing your home's value as well as a comparison with similar homes in the area
Home Values in the Area
Average Home Value in this Area
Purchase History
| Date | Buyer | Sale Price | Title Company |
|---|---|---|---|
| Ontiveros Richard | -- | Sierra | |
| Salome Richard E | -- | -- | |
| Salome Richard E | -- | -- | |
| Salome Richard E | -- | -- | |
| Salome Richard E | -- | -- | |
| Salome Richard E | -- | -- |
Source: Public Records
Mortgage History
| Date | Status | Borrower | Loan Amount |
|---|---|---|---|
| Open | Ontiveros Richard | $115,650 |
Source: Public Records
Tax History Compared to Growth
Tax History
| Year | Tax Paid | Tax Assessment Tax Assessment Total Assessment is a certain percentage of the fair market value that is determined by local assessors to be the total taxable value of land and additions on the property. | Land | Improvement |
|---|---|---|---|---|
| 2025 | $5,761 | $292,640 | $35,328 | $257,312 |
| 2024 | $5,761 | $221,922 | $35,328 | $186,594 |
| 2023 | $5,312 | $192,034 | $25,891 | $166,143 |
| 2022 | $5,253 | $177,472 | $25,891 | $151,581 |
| 2021 | $3,930 | $125,880 | $25,891 | $99,989 |
| 2020 | $4,485 | $145,918 | $17,539 | $128,379 |
| 2018 | $3,745 | $126,540 | $17,539 | $109,001 |
| 2017 | $3,604 | $127,957 | $17,539 | $110,418 |
| 2016 | $3,838 | $136,268 | $17,539 | $118,729 |
| 2015 | $3,729 | $136,268 | $17,539 | $118,729 |
| 2014 | $3,729 | $136,268 | $17,539 | $118,729 |
Source: Public Records
Map
Nearby Homes
- 2610 Frankfort Ave
- PN-391630 Alabama St
- 2903 Savannah Ave
- 2816 N Piedras St
- 2917 Mobile Ave
- 3009 Savannah Ave
- 3018 Sacramento Ave
- 2300 Red Sky Ln
- 2735 Aurora Ave
- 2406 Lebanon Ave
- 2624 Aurora Ave
- 3204 Memphis Ave
- 3125 Hamilton Ave
- PN-258825 Tbd
- 3215 Mobile Ave
- 2630 Wheeling Ave
- 1813 & 181 Alabama St
- 3031 Fort Blvd
- 2510 Federal Ave
- 3027 Morehead Ave
- 2630 Nashville Ave
- 2614 Nashville Ave Unit 2616
- 2628 Nashville Ave
- 2621 Memphis Ave
- 2625 Memphis Ave
- 2617 Memphis Ave
- 2608 Nashville Ave
- 2629 Memphis Ave
- 2615 Memphis Ave
- 2701 Louisiana St
- 2604 Nashville Ave
- 2609 Memphis Ave
- 2605 Memphis Ave
- 2610 Louisiana St
- 2600 Nashville Ave
- 2701 Memphis Ave
- 2610 Alabama St
- 2624 Memphis Ave
- 2630 Memphis Ave
- 2616 Memphis Ave