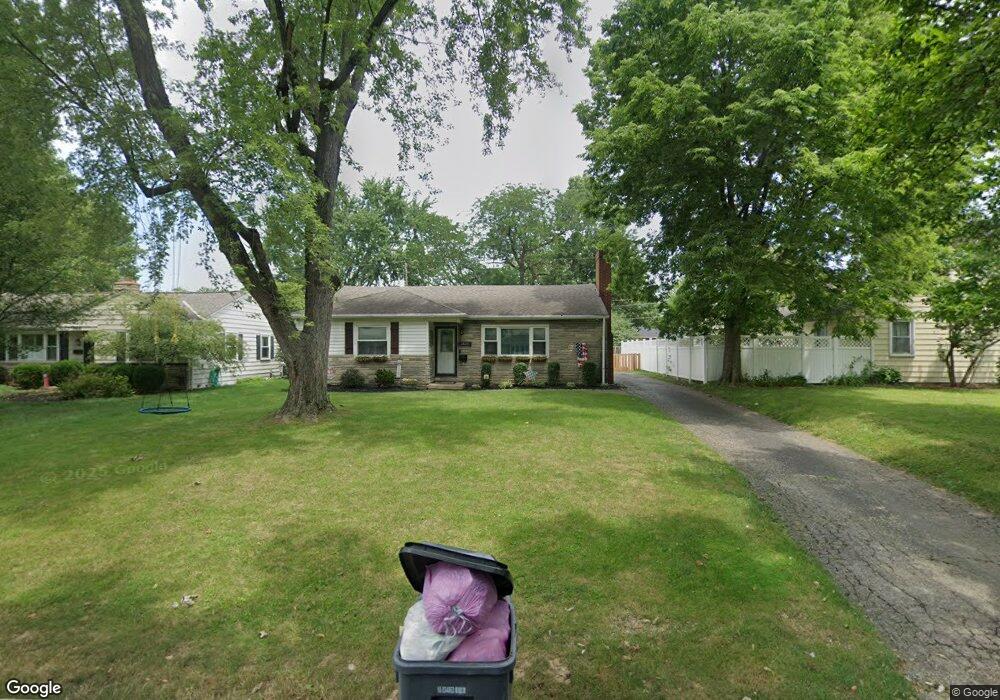
2620 Nottingham Rd Columbus, OH 43221
Estimated Value: $459,000 - $511,000
4
Beds
3
Baths
1,911
Sq Ft
$252/Sq Ft
Est. Value
About This Home
This home is located at 2620 Nottingham Rd, Columbus, OH 43221 and is currently estimated at $481,874, approximately $252 per square foot. 2620 Nottingham Rd is a home located in Franklin County with nearby schools including Windermere Elementary School, Hastings Middle School, and Upper Arlington High School.
Ownership History
Date
Name
Owned For
Owner Type
Purchase Details
Closed on
Apr 23, 2013
Sold by
Cooper Donald D
Bought by
Onifer Shawn P
Current Estimated Value
Home Financials for this Owner
Home Financials are based on the most recent Mortgage that was taken out on this home.
Original Mortgage
$206,196
Outstanding Balance
$145,744
Interest Rate
3.5%
Mortgage Type
FHA
Estimated Equity
$336,130
Purchase Details
Closed on
Aug 2, 2002
Sold by
Nolan Ann B and Nolan James T
Bought by
Cooper Donald D
Home Financials for this Owner
Home Financials are based on the most recent Mortgage that was taken out on this home.
Original Mortgage
$150,312
Interest Rate
6.64%
Mortgage Type
FHA
Purchase Details
Closed on
Nov 25, 1998
Sold by
Nolan Ann Bertha
Bought by
Nolan Ann Bertha and Nolan James T
Create a Home Valuation Report for This Property
The Home Valuation Report is an in-depth analysis detailing your home's value as well as a comparison with similar homes in the area
Home Values in the Area
Average Home Value in this Area
Purchase History
| Date | Buyer | Sale Price | Title Company |
|---|---|---|---|
| Onifer Shawn P | $210,000 | None Available | |
| Cooper Donald D | $151,500 | Real Living Title | |
| Nolan Ann Bertha | -- | -- |
Source: Public Records
Mortgage History
| Date | Status | Borrower | Loan Amount |
|---|---|---|---|
| Open | Onifer Shawn P | $206,196 | |
| Previous Owner | Cooper Donald D | $150,312 |
Source: Public Records
Tax History Compared to Growth
Tax History
| Year | Tax Paid | Tax Assessment Tax Assessment Total Assessment is a certain percentage of the fair market value that is determined by local assessors to be the total taxable value of land and additions on the property. | Land | Improvement |
|---|---|---|---|---|
| 2024 | $7,590 | $124,220 | $49,980 | $74,240 |
| 2023 | $7,501 | $124,215 | $49,980 | $74,235 |
| 2022 | $6,852 | $93,560 | $32,130 | $61,430 |
| 2021 | $6,234 | $93,560 | $32,130 | $61,430 |
| 2020 | $6,852 | $93,560 | $32,130 | $61,430 |
| 2019 | $5,588 | $76,060 | $32,130 | $43,930 |
| 2018 | $5,169 | $76,060 | $32,130 | $43,930 |
| 2017 | $5,359 | $76,060 | $32,130 | $43,930 |
| 2016 | $4,809 | $70,850 | $25,730 | $45,120 |
| 2015 | $4,779 | $70,850 | $25,730 | $45,120 |
| 2014 | $4,686 | $70,850 | $25,730 | $45,120 |
| 2013 | $2,237 | $64,400 | $23,380 | $41,020 |
Source: Public Records
Map
Nearby Homes
- 2666 Shrewsbury Rd
- 2714 Woodstock Rd
- 2565 Nottingham Rd
- 2745 Cranford Rd
- 2680 Bristol Rd
- 2424 Nottingham Rd
- 2527 Wickliffe Rd
- 2401 Shrewsbury Rd
- 2413 Edgevale Rd
- 3441 Sunset Dr
- 2544 Zollinger Rd
- 2308 Shrewsbury Rd
- 3190 Kioka Ave
- 3163 S Dorchester Rd
- 3450 River Rhone Ln
- 2731 Clifton Rd
- 3920 Overdale Dr
- 3414 Loire Ln
- 2300 Hoxton Ct
- 2370 Zollinger Rd
- 3521 Kioka Ave
- 2636 Nottingham Rd
- 2611 Shrewsbury Rd
- 2619 Shrewsbury Rd
- 2603 Shrewsbury Rd
- 2627 Shrewsbury Rd
- 2621 Nottingham Rd
- 2592 Nottingham Rd
- 2629 Nottingham Rd
- 2617 Nottingham Rd
- 2635 Shrewsbury Rd
- 2637 Nottingham Rd
- 2585 Shrewsbury Rd
- 2652 Nottingham Rd
- 2645 Nottingham Rd
- 2584 Nottingham Rd
- 2643 Shrewsbury Rd
- 2595 Nottingham Rd
- 2577 Shrewsbury Rd
- 2660 Nottingham Rd