Estimated Value: $299,000 - $322,000
3
Beds
3
Baths
2,012
Sq Ft
$156/Sq Ft
Est. Value
About This Home
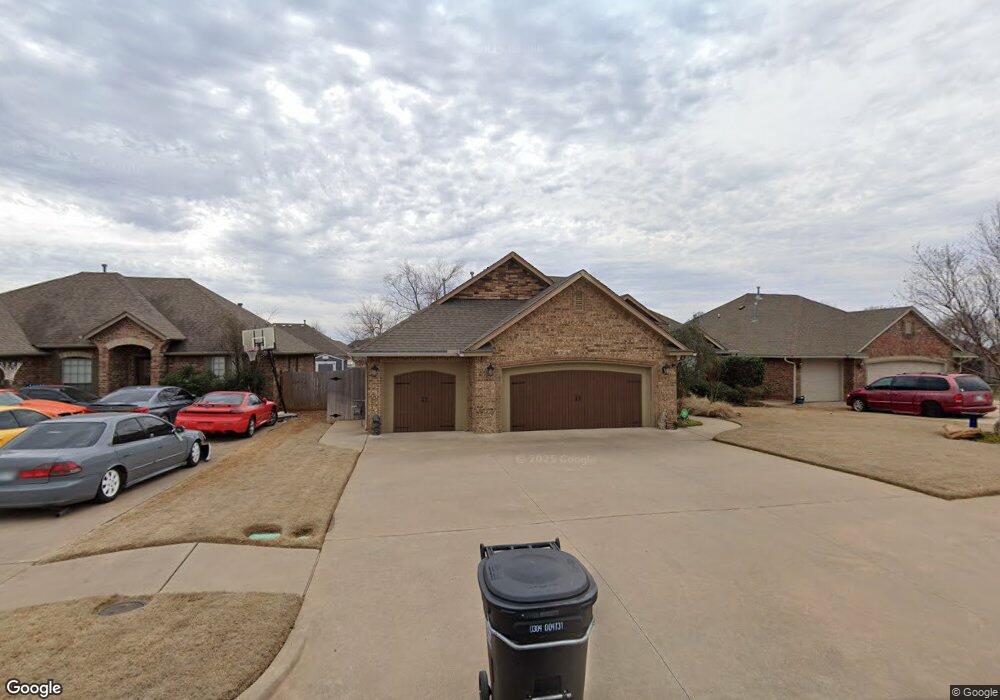
This home is located at 2620 SE 9th Cir, Moore, OK 73160 and is currently estimated at $312,907, approximately $155 per square foot. 2620 SE 9th Cir is a home located in Cleveland County with nearby schools including Heritage Trails Elementary School, Highland East Junior High School, and Moore High School.
Ownership History
Date
Name
Owned For
Owner Type
Purchase Details
Closed on
Aug 29, 2007
Sold by
Lemmon Sidney R and Lemmon Norman L
Bought by
Lemmon Sidney Robert and Lemmon Norma Lee
Current Estimated Value
Home Financials for this Owner
Home Financials are based on the most recent Mortgage that was taken out on this home.
Original Mortgage
$74,136
Interest Rate
6.72%
Mortgage Type
New Conventional
Purchase Details
Closed on
Sep 1, 2005
Sold by
R & R Lland Development Llc
Bought by
Silver Stone Homes Llc
Home Financials for this Owner
Home Financials are based on the most recent Mortgage that was taken out on this home.
Original Mortgage
$24,499
Interest Rate
7.5%
Mortgage Type
Future Advance Clause Open End Mortgage
Create a Home Valuation Report for This Property
The Home Valuation Report is an in-depth analysis detailing your home's value as well as a comparison with similar homes in the area
Home Values in the Area
Average Home Value in this Area
Purchase History
| Date | Buyer | Sale Price | Title Company |
|---|---|---|---|
| Lemmon Sidney Robert | -- | None Available | |
| Lemmon Sidney R | $218,000 | None Available | |
| Silver Stone Homes Llc | $26,500 | None Available |
Source: Public Records
Mortgage History
| Date | Status | Borrower | Loan Amount |
|---|---|---|---|
| Closed | Lemmon Sidney R | $74,136 | |
| Previous Owner | Silver Stone Homes Llc | $24,499 |
Source: Public Records
Tax History
| Year | Tax Paid | Tax Assessment Tax Assessment Total Assessment is a certain percentage of the fair market value that is determined by local assessors to be the total taxable value of land and additions on the property. | Land | Improvement |
|---|---|---|---|---|
| 2025 | $3,631 | $30,650 | $4,809 | $25,841 |
| 2023 | $3,399 | $28,891 | $4,619 | $24,272 |
| 2022 | $3,346 | $28,049 | $4,465 | $23,584 |
| 2021 | $3,259 | $27,232 | $5,016 | $22,216 |
| 2020 | $3,162 | $26,439 | $4,920 | $21,519 |
| 2019 | $3,133 | $25,743 | $4,806 | $20,937 |
| 2018 | $3,040 | $24,994 | $3,420 | $21,574 |
| 2017 | $3,055 | $24,994 | $0 | $0 |
| 2016 | $3,076 | $24,994 | $3,420 | $21,574 |
| 2015 | $2,726 | $24,497 | $3,411 | $21,086 |
| 2014 | $2,706 | $23,783 | $3,420 | $20,363 |
Source: Public Records
Map
Nearby Homes
- 1113 Lanie Ln
- 1117 Kelsi Dr
- 1009 Samantha Ln
- 2804 SE 8th St
- 1113 Lindsey Ln
- 605 Kelsi Dr
- 2504 SE 11th St
- 2636 SE 5th St
- 2433 SE 12th St
- 2200 SE 8th St
- 2304 SE 5th St
- 2113 SE 8th St
- 1009 Ashwood Ln
- 2025 Wimberley Creek Dr
- 105 S Olde Bridge Rd
- 1733 Pin Cherry Ln
- 1800 Pin Cherry Ln
- 1820 Pin Cherry Ln
- 1717 Pin Cherry Ln
- 1804 Pin Cherry Ln
- 2624 SE 9th Cir
- 2616 SE 9th Cir
- 2628 SE 9th Cir
- 2617 SE 10th St
- 2621 SE 10th St
- 2629 SE 10th St
- 2612 SE 9th Cir
- 2621 SE 9th Cir
- 2625 SE 9th Cir
- 2613 SE 10th St
- 2629 SE 9th Cir
- 2632 SE 9th Cir
- 2609 SE 9th Cir
- 2617 SE 9th Cir
- 2633 SE 10th St
- 2633 SE 9th Cir
- 2636 SE 9th Cir
- 2613 SE 9th Cir
- 2624 SE 10th St
- 2637 SE 10th St
Your Personal Tour Guide
Ask me questions while you tour the home.