Estimated Value: $599,095 - $660,000
5
Beds
3
Baths
2,656
Sq Ft
$239/Sq Ft
Est. Value
About This Home
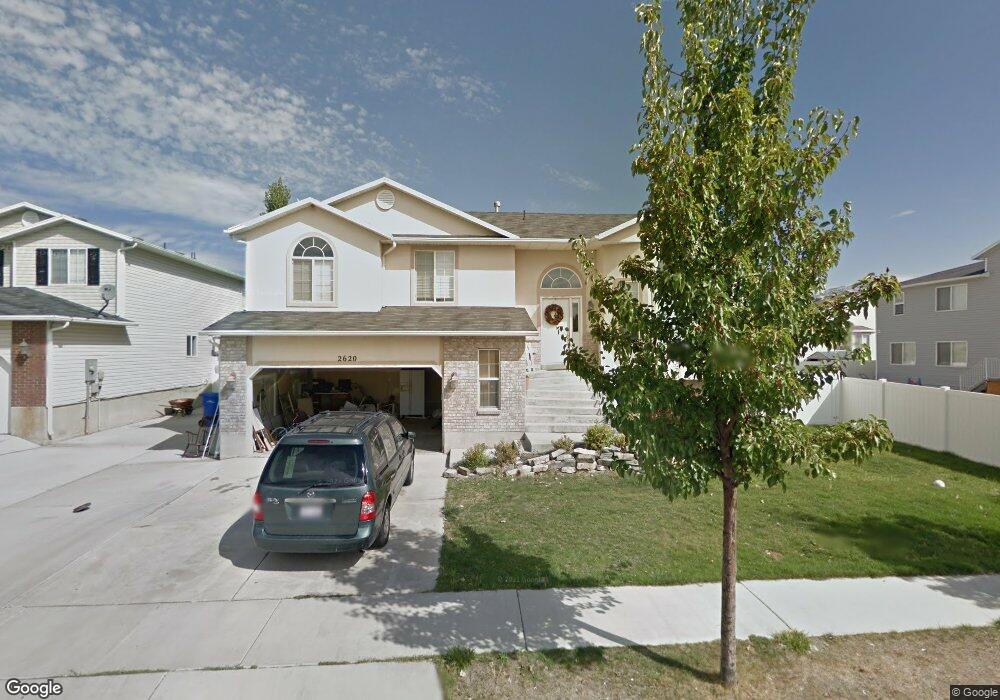
This home is located at 2620 W 1775 N, Lehi, UT 84043 and is currently estimated at $635,524, approximately $239 per square foot. 2620 W 1775 N is a home located in Utah County with nearby schools including North Point Elementary School, Willowcreek Middle School, and Lehi High School.
Ownership History
Date
Name
Owned For
Owner Type
Purchase Details
Closed on
Mar 21, 2022
Sold by
Wyatt Austin John
Bought by
Austin John Wyatt and Austin Bonnie Sue
Current Estimated Value
Home Financials for this Owner
Home Financials are based on the most recent Mortgage that was taken out on this home.
Original Mortgage
$409,500
Outstanding Balance
$383,625
Interest Rate
4.16%
Mortgage Type
New Conventional
Estimated Equity
$251,899
Purchase Details
Closed on
Jun 3, 2010
Sold by
Austin John W
Bought by
Austin John W and Austin Bonnie Sue
Home Financials for this Owner
Home Financials are based on the most recent Mortgage that was taken out on this home.
Original Mortgage
$231,877
Interest Rate
5.5%
Mortgage Type
FHA
Purchase Details
Closed on
Nov 27, 2000
Sold by
Woodside Homes Corp
Bought by
Davis Mark P and Davis Scarlet
Home Financials for this Owner
Home Financials are based on the most recent Mortgage that was taken out on this home.
Original Mortgage
$161,950
Interest Rate
7.86%
Create a Home Valuation Report for This Property
The Home Valuation Report is an in-depth analysis detailing your home's value as well as a comparison with similar homes in the area
Home Values in the Area
Average Home Value in this Area
Purchase History
| Date | Buyer | Sale Price | Title Company |
|---|---|---|---|
| Austin John Wyatt | -- | Trident Title | |
| Austin John Wyatt | -- | Trident Title | |
| Austin John W | -- | Metro National Title | |
| Austin John W | -- | Metro National Title | |
| Davis Mark P | -- | First American Title Co |
Source: Public Records
Mortgage History
| Date | Status | Borrower | Loan Amount |
|---|---|---|---|
| Open | Austin John Wyatt | $409,500 | |
| Previous Owner | Austin John W | $231,877 | |
| Previous Owner | Davis Mark P | $161,950 |
Source: Public Records
Tax History Compared to Growth
Tax History
| Year | Tax Paid | Tax Assessment Tax Assessment Total Assessment is a certain percentage of the fair market value that is determined by local assessors to be the total taxable value of land and additions on the property. | Land | Improvement |
|---|---|---|---|---|
| 2025 | $2,389 | $288,915 | $192,600 | $332,700 |
| 2024 | $2,389 | $279,565 | $0 | $0 |
| 2023 | $2,304 | $292,820 | $0 | $0 |
| 2022 | $2,357 | $290,400 | $0 | $0 |
| 2021 | $2,129 | $396,400 | $111,500 | $284,900 |
| 2020 | $2,007 | $369,500 | $103,200 | $266,300 |
| 2019 | $1,750 | $334,800 | $103,200 | $231,600 |
| 2018 | $1,710 | $309,300 | $92,000 | $217,300 |
| 2017 | $1,643 | $158,015 | $0 | $0 |
| 2016 | $1,592 | $142,065 | $0 | $0 |
| 2015 | $1,461 | $123,750 | $0 | $0 |
| 2014 | $1,424 | $119,900 | $0 | $0 |
Source: Public Records
Map
Nearby Homes
- 1696 N 2640 W
- Huntington Plan at Pioneer Meadows
- Silver Lake Plan at Pioneer Meadows
- Summit Plan at Pioneer Meadows
- Palisade Plan at Pioneer Meadows
- 2189 N 2600 W
- 1870 N 2230 W
- 1896 N 2230 W
- 1908 N 2230 W
- 2464 W 2250 N
- 1302 N 2450 W
- 1970 N 2090 St W
- Accord Plan at Riverwalk
- Interlude Plan at Riverwalk
- Trio Plan at Riverwalk
- Fortissimo Plan at Riverwalk
- Ballad Plan at Riverwalk
- Tenor Plan at Riverwalk
- Madrigal Plan at Riverwalk
- Timpani Plan at Riverwalk