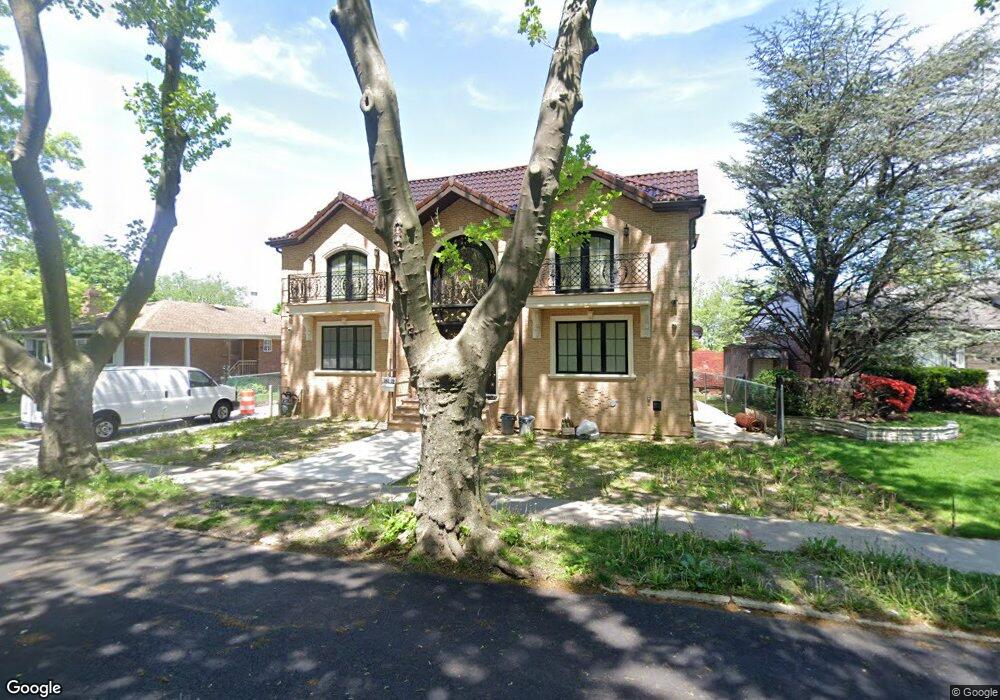
26209 Grand Central Pkwy Little Neck, NY 11362
Little Neck NeighborhoodEstimated Value: $1,118,650 - $1,501,000
--
Bed
--
Bath
4,064
Sq Ft
$329/Sq Ft
Est. Value
About This Home
This home is located at 26209 Grand Central Pkwy, Little Neck, NY 11362 and is currently estimated at $1,338,883, approximately $329 per square foot. 26209 Grand Central Pkwy is a home located in Queens County with nearby schools including P.S. 221Q The North Hills School, Louis Pasteur Middle School 67, and Benjamin N Cardozo High School.
Ownership History
Date
Name
Owned For
Owner Type
Purchase Details
Closed on
Dec 15, 2020
Sold by
Destefano Nicholas
Bought by
Hajrah Properties Llc
Current Estimated Value
Home Financials for this Owner
Home Financials are based on the most recent Mortgage that was taken out on this home.
Original Mortgage
$546,000
Outstanding Balance
$483,859
Interest Rate
2.7%
Mortgage Type
Purchase Money Mortgage
Estimated Equity
$855,024
Purchase Details
Closed on
Sep 24, 2007
Sold by
Sherr Co-Executrix Sande and Sherr Co-Executrix
Bought by
Destefano Nicholas
Home Financials for this Owner
Home Financials are based on the most recent Mortgage that was taken out on this home.
Original Mortgage
$285,000
Interest Rate
6.59%
Mortgage Type
Purchase Money Mortgage
Create a Home Valuation Report for This Property
The Home Valuation Report is an in-depth analysis detailing your home's value as well as a comparison with similar homes in the area
Home Values in the Area
Average Home Value in this Area
Purchase History
| Date | Buyer | Sale Price | Title Company |
|---|---|---|---|
| Hajrah Properties Llc | $840,000 | -- | |
| Destefano Nicholas | $700,000 | -- | |
| Destefano Nicholas | $700,000 | -- |
Source: Public Records
Mortgage History
| Date | Status | Borrower | Loan Amount |
|---|---|---|---|
| Open | Hajrah Properties Llc | $546,000 | |
| Previous Owner | Destefano Nicholas | $285,000 |
Source: Public Records
Tax History Compared to Growth
Tax History
| Year | Tax Paid | Tax Assessment Tax Assessment Total Assessment is a certain percentage of the fair market value that is determined by local assessors to be the total taxable value of land and additions on the property. | Land | Improvement |
|---|---|---|---|---|
| 2025 | $14,640 | $103,483 | $20,463 | $83,020 |
| 2024 | $14,640 | $72,890 | $19,400 | $53,490 |
| 2023 | $11,035 | $54,941 | $20,970 | $33,971 |
| 2022 | $10,885 | $66,060 | $18,660 | $47,400 |
| 2021 | $10,825 | $62,400 | $18,660 | $43,740 |
| 2020 | $9,976 | $60,480 | $18,660 | $41,820 |
| 2019 | $9,285 | $64,680 | $18,660 | $46,020 |
| 2018 | $9,035 | $45,784 | $14,014 | $31,770 |
| 2017 | $8,963 | $45,437 | $14,766 | $30,671 |
| 2016 | $8,259 | $45,437 | $14,766 | $30,671 |
| 2015 | $4,950 | $40,440 | $16,797 | $23,643 |
| 2014 | $4,950 | $38,154 | $17,122 | $21,032 |
Source: Public Records
Map
Nearby Homes
- 262-39 60th Ave
- 264-11 60th Ave
- 255-10 61st Ave Unit 907
- 269-10 Grand Central Pkwy Unit 24-S
- 269-10 Grand Central Pkwy Unit 2W
- 269-10 Grand Central Pkwy Unit 8Y
- 269-10 Grand Central Pkwy Unit 30W
- 269-10 Grand Central Pkwy Unit 32P
- 269-10 Grand Central Pkwy Unit 4V
- 269-10 Grand Central Pkwy Unit 27T
- 269-10 Grand Central Pkwy Unit 8-X
- 269-10 Grand Central Pkwy Unit A19-20
- 269-10 Grand Central Pkwy Unit 30N
- 269-10 Grand Central Pkwy Unit 15-E
- 269-10 Grand Central Pkwy Unit 2C
- 26910 Grand Central Pkwy Unit 11L
- 26910 Grand Central Pkwy Unit 16N
- 26910 Grand Central Pkwy Unit 5M
- 26910 Grand Central Pkwy Unit 31G
- 26910 Grand Central Pkwy Unit 17Y
- 262-09 Grand Central Pkwy
- 26217 Grand Central Pkwy
- 26203 Grand Central Pkwy
- 26208 60th Rd
- 26225 Grand Central Pkwy
- 262-08 60th Rd
- 26212 60th Rd
- 26204 60th Rd
- 26212 60th Rd
- 262-16 60th Rd
- 26216 60th Rd
- 26204 60th Rd
- 26216 60th Rd
- 262-12 60th Rd
- 262-20 60 Rd
- 26220 60th Rd
- 57-38262 262 St
- 26231 Grand Central Pkwy
- 26231 Grand Central Pkwy
- 26224 60th Rd