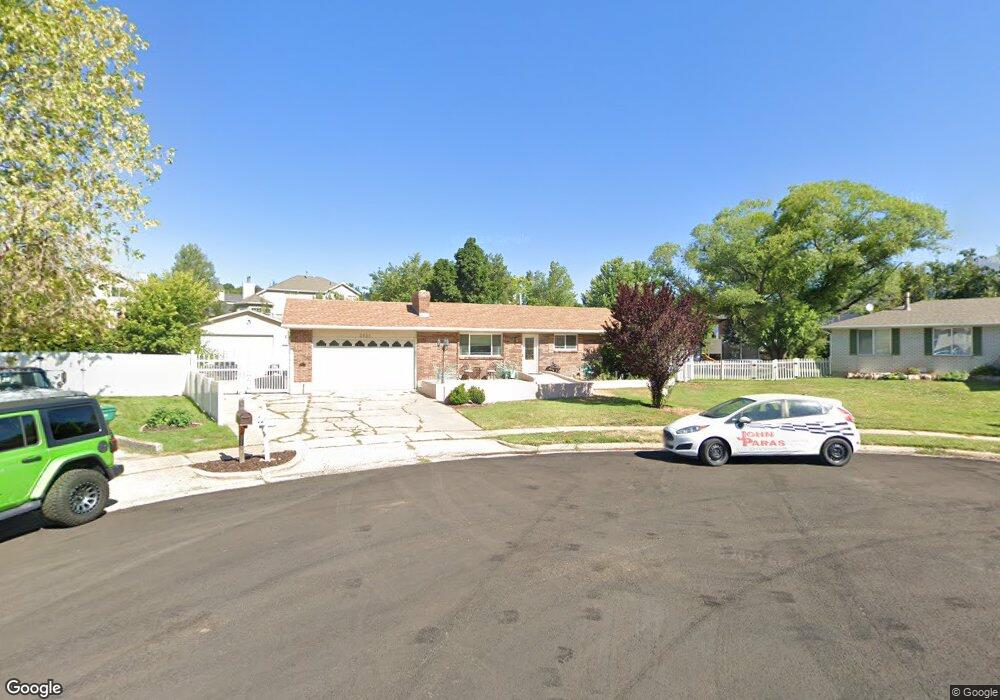
2621 E 3525 N Layton, UT 84040
Estimated Value: $529,000 - $578,715
5
Beds
3
Baths
2,490
Sq Ft
$220/Sq Ft
Est. Value
About This Home
This home is located at 2621 E 3525 N, Layton, UT 84040 and is currently estimated at $548,679, approximately $220 per square foot. 2621 E 3525 N is a home located in Davis County with nearby schools including Mountain View Elementary School, North Layton Junior High School, and Northridge High School.
Ownership History
Date
Name
Owned For
Owner Type
Purchase Details
Closed on
Jan 10, 2017
Sold by
Thompson David P
Bought by
Thompson David P and Thompson Natalie C
Current Estimated Value
Home Financials for this Owner
Home Financials are based on the most recent Mortgage that was taken out on this home.
Original Mortgage
$244,759
Outstanding Balance
$202,646
Interest Rate
4.37%
Mortgage Type
FHA
Estimated Equity
$346,033
Purchase Details
Closed on
Aug 8, 2008
Sold by
Thompson David P
Bought by
Thompson David P
Home Financials for this Owner
Home Financials are based on the most recent Mortgage that was taken out on this home.
Original Mortgage
$240,468
Interest Rate
6.37%
Mortgage Type
FHA
Purchase Details
Closed on
May 22, 1996
Sold by
Barnes Mark and Barnes Stacie
Bought by
Thompson David P
Home Financials for this Owner
Home Financials are based on the most recent Mortgage that was taken out on this home.
Original Mortgage
$116,000
Interest Rate
8.07%
Create a Home Valuation Report for This Property
The Home Valuation Report is an in-depth analysis detailing your home's value as well as a comparison with similar homes in the area
Home Values in the Area
Average Home Value in this Area
Purchase History
| Date | Buyer | Sale Price | Title Company |
|---|---|---|---|
| Thompson David P | -- | -- | |
| Thompson David P | -- | First American | |
| Thompson David P | -- | Associated Title Company |
Source: Public Records
Mortgage History
| Date | Status | Borrower | Loan Amount |
|---|---|---|---|
| Open | Thompson David P | $244,759 | |
| Closed | Thompson David P | $240,468 | |
| Closed | Thompson David P | $116,000 |
Source: Public Records
Tax History
| Year | Tax Paid | Tax Assessment Tax Assessment Total Assessment is a certain percentage of the fair market value that is determined by local assessors to be the total taxable value of land and additions on the property. | Land | Improvement |
|---|---|---|---|---|
| 2025 | $3,024 | $289,300 | $163,800 | $125,500 |
| 2024 | $2,865 | $278,300 | $182,139 | $96,161 |
| 2023 | $2,808 | $486,000 | $183,307 | $302,693 |
| 2022 | $2,953 | $279,950 | $98,110 | $181,840 |
| 2021 | $2,615 | $368,000 | $153,498 | $214,502 |
| 2020 | $2,405 | $324,000 | $128,406 | $195,594 |
| 2019 | $2,384 | $317,000 | $128,621 | $188,379 |
| 2018 | $2,189 | $292,000 | $127,550 | $164,450 |
| 2016 | $1,935 | $135,465 | $59,077 | $76,388 |
| 2015 | $1,925 | $128,975 | $59,077 | $69,898 |
| 2014 | $1,776 | $122,295 | $51,371 | $70,924 |
| 2013 | -- | $123,021 | $33,920 | $89,101 |
Source: Public Records
Map
Nearby Homes
- 3297 N Layton Ridge Dr
- 3232 N Redtail Way
- 2357 E 8100 S
- 2353 Canyon View Dr
- 8036 S 2575 E
- 2586 Deer Run Dr
- 7841 Peachwood Dr
- 7886 S 2100 E
- 1827 E Whitetail Dr
- 1821 E Whitetail Way
- 1935 Deere Valley Dr
- 7897 S 2700 E Unit 303
- 7897 S 2700 E Unit 305
- 2597 N 2300 E
- 7980 S 2800 E
- 2569 N 2900 E
- 1911 Deere Valley Dr
- 2765 E 7825 S
- 1785 E 2825 N
- 1731 E 2825 N
Your Personal Tour Guide
Ask me questions while you tour the home.