G
Landlord's Agent in 2024
Gabriel Mendoza
eXp Realty
(480) 588-8356
6 Total Sales
Estimated Value: $402,594 - $435,000
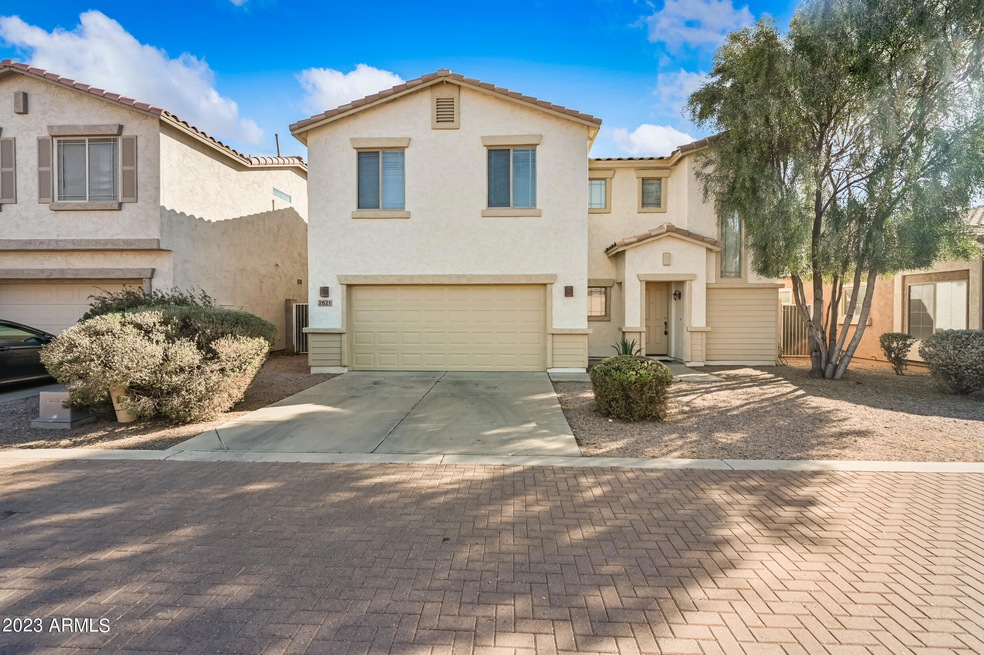
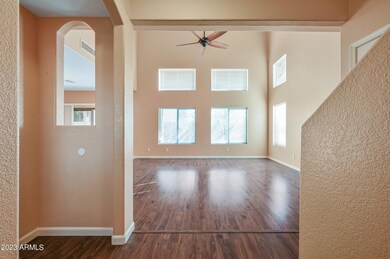
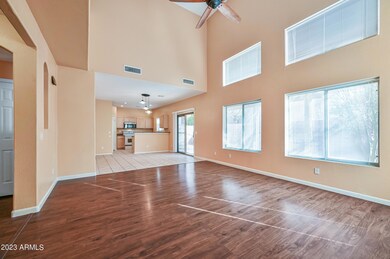
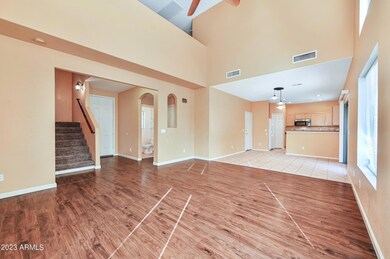
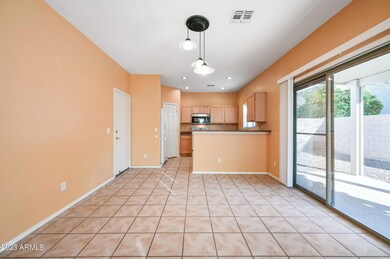
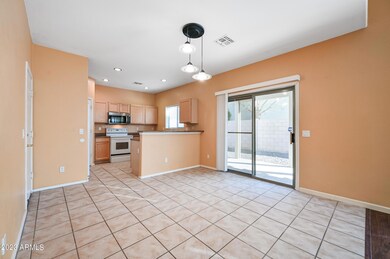
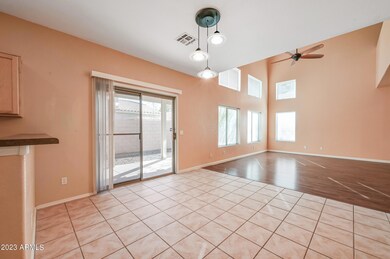
Beautiful and super clean home in Heritage Park at Cooper Commons. This home boasts an open floor plan, vaulted ceilings, wood flooring in great room, nice two-tone paint entirely, upgraded ceiling fans and light fixtures, newer carpet, tiles in all right places. Flat cooktop, microwave, fridge included, walk-in-pantry. Washer and dryer. Window treatment throughout, 2-car garage, extra storage under staircase and extended large covered patio. This home is in private cul-de-sac and very quiet. Don't miss this one. Heritage Park has playground, green belt and a nice community pool. Cooper Commons offers miles of walking trail, basketball court and great green belt. Hurry, this beauty won't last long. Tenant to verify facts, figures, and schools.
Last Agent to Rent the Property
eXp Realty License #SA703578000 Listed on: 04/17/2024
Last Renter's Agent
Non-MLS Agent
Non-MLS Office
| Date | Buyer | Sale Price | Title Company |
|---|---|---|---|
| Contreras Deryck | $255,000 | Empire West Title Agency Llc | |
| Waterview Properties Llc | -- | Accommodation | |
| Xie Fangning | -- | Great American Title Aency I | |
| Xie Fangning | $141,050 | Great American Title Agency | |
| Torres Sean M | -- | First American Title Ins Co | |
| Torres Sean M | $134,398 | Security Title Agency |
| Date | Status | Borrower | Loan Amount |
|---|---|---|---|
| Open | Contreras Deryck | $191,250 | |
| Previous Owner | Torres Sean M | $97,000 | |
| Previous Owner | Torres Sean M | $119,150 |
| Date | Event | Price | List to Sale | Price per Sq Ft | Prior Sale |
|---|---|---|---|---|---|
| 05/15/2024 05/15/24 | Rented | $2,000 | 0.0% | -- | |
| 04/23/2024 04/23/24 | Under Contract | -- | -- | -- | |
| 04/17/2024 04/17/24 | For Rent | $2,000 | 0.0% | -- | |
| 04/07/2023 04/07/23 | Rented | $2,000 | 0.0% | -- | |
| 03/20/2023 03/20/23 | Under Contract | -- | -- | -- | |
| 03/10/2023 03/10/23 | For Rent | $2,000 | 0.0% | -- | |
| 03/04/2022 03/04/22 | Rented | $2,000 | 0.0% | -- | |
| 02/24/2022 02/24/22 | Under Contract | -- | -- | -- | |
| 02/19/2022 02/19/22 | For Rent | $2,000 | +43.4% | -- | |
| 09/01/2018 09/01/18 | Rented | $1,395 | 0.0% | -- | |
| 08/31/2018 08/31/18 | Under Contract | -- | -- | -- | |
| 08/15/2018 08/15/18 | For Rent | $1,395 | 0.0% | -- | |
| 08/14/2018 08/14/18 | Sold | $255,000 | 0.0% | $155 / Sq Ft | View Prior Sale |
| 07/16/2018 07/16/18 | Pending | -- | -- | -- | |
| 06/09/2018 06/09/18 | Price Changed | $255,000 | -3.8% | $155 / Sq Ft | |
| 05/17/2018 05/17/18 | For Sale | $265,000 | 0.0% | $161 / Sq Ft | |
| 03/26/2016 03/26/16 | Rented | $1,300 | 0.0% | -- | |
| 03/26/2016 03/26/16 | Under Contract | -- | -- | -- | |
| 03/07/2016 03/07/16 | Price Changed | $1,300 | -3.7% | $1 / Sq Ft | |
| 02/24/2016 02/24/16 | Price Changed | $1,350 | +3.8% | $1 / Sq Ft | |
| 02/24/2016 02/24/16 | Price Changed | $1,300 | -3.7% | $1 / Sq Ft | |
| 02/04/2016 02/04/16 | For Rent | $1,350 | +8.0% | -- | |
| 04/15/2014 04/15/14 | Rented | $1,250 | 0.0% | -- | |
| 04/12/2014 04/12/14 | Under Contract | -- | -- | -- | |
| 02/01/2014 02/01/14 | For Rent | $1,250 | 0.0% | -- | |
| 08/01/2013 08/01/13 | Rented | $1,250 | 0.0% | -- | |
| 07/26/2013 07/26/13 | Under Contract | -- | -- | -- | |
| 07/11/2013 07/11/13 | For Rent | $1,250 | +4.6% | -- | |
| 04/22/2012 04/22/12 | Rented | $1,195 | -4.4% | -- | |
| 04/17/2012 04/17/12 | Under Contract | -- | -- | -- | |
| 03/28/2012 03/28/12 | For Rent | $1,250 | 0.0% | -- | |
| 03/26/2012 03/26/12 | Sold | $141,050 | +4.5% | $86 / Sq Ft | View Prior Sale |
| 02/27/2012 02/27/12 | Pending | -- | -- | -- | |
| 02/24/2012 02/24/12 | For Sale | $135,000 | -- | $82 / Sq Ft |
| Year | Tax Paid | Tax Assessment Tax Assessment Total Assessment is a certain percentage of the fair market value that is determined by local assessors to be the total taxable value of land and additions on the property. | Land | Improvement |
|---|---|---|---|---|
| 2025 | $1,663 | $17,610 | -- | -- |
| 2024 | $1,605 | $16,771 | -- | -- |
| 2023 | $1,605 | $30,150 | $6,030 | $24,120 |
| 2022 | $1,555 | $22,520 | $4,500 | $18,020 |
| 2021 | $1,595 | $20,870 | $4,170 | $16,700 |
| 2020 | $1,586 | $19,170 | $3,830 | $15,340 |
| 2019 | $1,531 | $16,830 | $3,360 | $13,470 |
| 2018 | $1,486 | $15,800 | $3,160 | $12,640 |
| 2017 | $1,397 | $14,870 | $2,970 | $11,900 |
| 2016 | $1,349 | $14,460 | $2,890 | $11,570 |
| 2015 | $1,293 | $13,400 | $2,680 | $10,720 |
G
Landlord's Agent in 2024
Gabriel Mendoza
eXp Realty
(480) 588-8356
6 Total Sales
N
Tenant's Agent in 2024
Non-MLS Agent
Non-MLS Office
J
Seller's Agent in 2022
Julie Funk
Opulent Real Estate Group
(319) 270-0578

Seller's Agent in 2018
Gary Chen
DeLex Realty
(480) 678-9882
5 in this area
96 Total Sales
Seller's Agent in 2018
Hemameena Muralidaran
Investar Real Estate Specialists
(480) 468-6638
1 in this area
4 Total Sales
H
Seller Co-Listing Agent in 2018
Hellen Chen
Arizona United Realty
Source: Arizona Regional Multiple Listing Service (ARMLS)
MLS Number: 6692965
APN: 303-56-609
Disclaimer: Certain information contained herein is derived from information provided by parties other than Homes.com. All information provided is deemed reliable, but is not guaranteed to be accurate and should be independently verified.
![]() All information should be verified by the recipient and none is guaranteed as accurate by ARMLS
All information should be verified by the recipient and none is guaranteed as accurate by ARMLS
Listing Information presented by local MLS brokerage: Ten-X, local REALTOR®- Arlene Richardson - (888)-952-6393