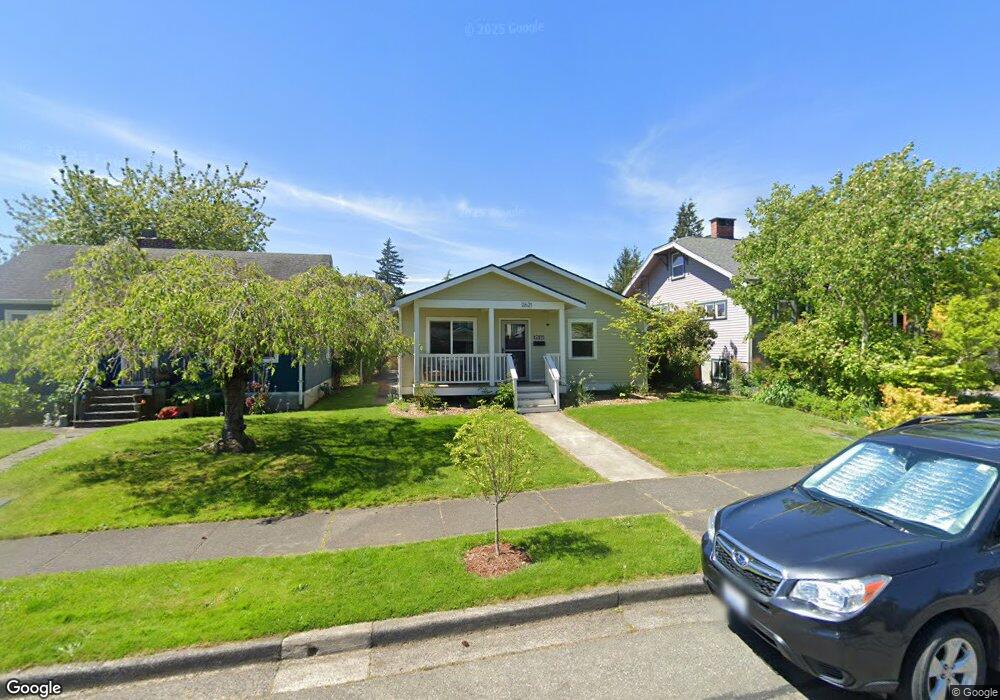
2621 Grant St Bellingham, WA 98225
Sunnyland NeighborhoodEstimated Value: $623,000 - $708,000
2
Beds
1
Bath
960
Sq Ft
$698/Sq Ft
Est. Value
About This Home
This home is located at 2621 Grant St, Bellingham, WA 98225 and is currently estimated at $670,525, approximately $698 per square foot. 2621 Grant St is a home located in Whatcom County with nearby schools including Sunnyland Elementary School, Whatcom Middle School, and Bellingham High School.
Ownership History
Date
Name
Owned For
Owner Type
Purchase Details
Closed on
Apr 24, 2024
Sold by
Hadfield Scott and Hadfield Heather
Bought by
Faulstich Dale Stephen and Faulstich Heather Lynn
Current Estimated Value
Purchase Details
Closed on
Feb 19, 2024
Sold by
Petersen Kris and Petersen Esta
Bought by
Hadfield Scott and Hadfield Heather
Purchase Details
Closed on
Jul 17, 2014
Sold by
Massey Floyd Kenneth
Bought by
Petersen Kris and Petersen Esta
Create a Home Valuation Report for This Property
The Home Valuation Report is an in-depth analysis detailing your home's value as well as a comparison with similar homes in the area
Home Values in the Area
Average Home Value in this Area
Purchase History
| Date | Buyer | Sale Price | Title Company |
|---|---|---|---|
| Faulstich Dale Stephen | $705,000 | Whatcom Land Title | |
| Hadfield Scott | $313 | None Listed On Document | |
| Petersen Kris | $127,753 | Chicago Title Insurance |
Source: Public Records
Tax History Compared to Growth
Tax History
| Year | Tax Paid | Tax Assessment Tax Assessment Total Assessment is a certain percentage of the fair market value that is determined by local assessors to be the total taxable value of land and additions on the property. | Land | Improvement |
|---|---|---|---|---|
| 2024 | $3,941 | $639,177 | $246,304 | $392,873 |
| 2023 | $3,941 | $506,296 | $252,560 | $253,736 |
| 2022 | $3,218 | $436,470 | $217,728 | $218,742 |
| 2021 | $3,157 | $346,405 | $172,800 | $173,605 |
| 2020 | $3,130 | $320,745 | $160,000 | $160,745 |
| 2019 | $2,802 | $307,405 | $146,406 | $160,999 |
| 2018 | $2,822 | $275,947 | $131,446 | $144,501 |
| 2017 | $2,432 | $237,581 | $113,168 | $124,413 |
| 2016 | $2,129 | $214,028 | $101,552 | $112,476 |
| 2015 | $1,336 | $195,038 | $92,752 | $102,286 |
| 2014 | -- | $118,366 | $88,000 | $30,366 |
| 2013 | -- | $127,473 | $82,950 | $44,523 |
Source: Public Records
Map
Nearby Homes
- 2623 Grant St
- 2617 Grant St
- 2629 Grant St
- 2615 Grant St
- 2633 Grant St
- 2611 Grant St
- 2622 Franklin St
- 2624 Franklin St
- 2618 Franklin St
- 2630 Franklin St
- 2614 Franklin St
- 423 E North St
- 413 E North St
- 2610 Franklin St
- 2632 Franklin St
- 2620 Grant St
- 2618 Grant St
- 2626 Grant St
- 407 E North St
- 2636 Franklin St