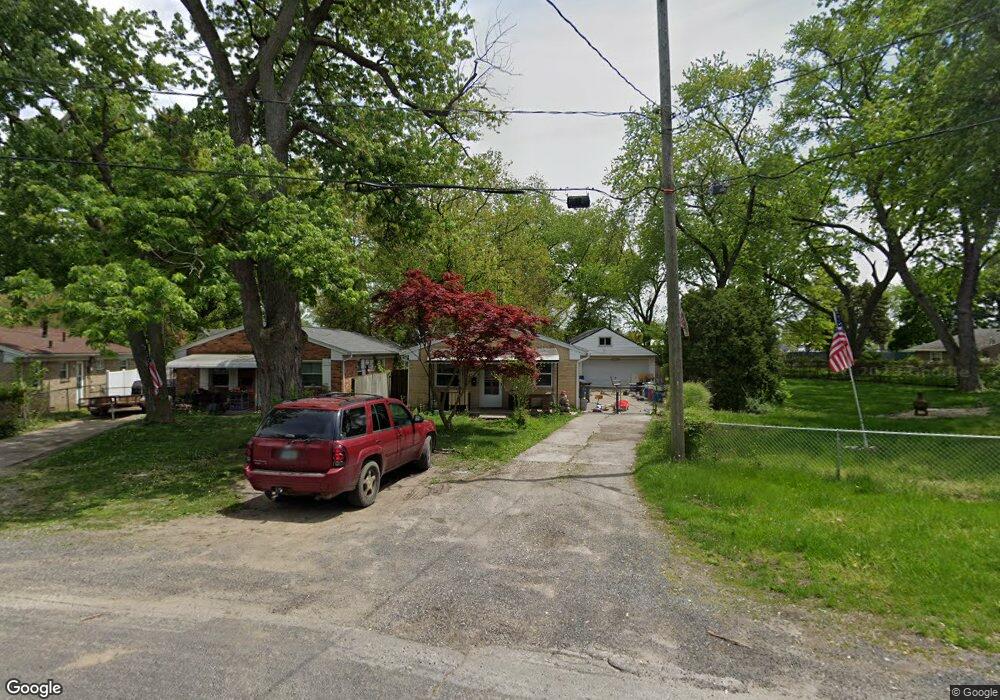
2621 Lima Ave Toledo, OH 43613
Whitmer-Trilby NeighborhoodEstimated Value: $67,000 - $135,000
3
Beds
1
Bath
960
Sq Ft
$107/Sq Ft
Est. Value
About This Home
This home is located at 2621 Lima Ave, Toledo, OH 43613 and is currently estimated at $102,624, approximately $106 per square foot. 2621 Lima Ave is a home located in Lucas County with nearby schools including Jefferson Junior High School, Washington Junior High School, and Whitmer High School.
Ownership History
Date
Name
Owned For
Owner Type
Purchase Details
Closed on
Nov 11, 2020
Sold by
Woodbridge Investment Group Llc
Bought by
Wickliff Douglas
Current Estimated Value
Home Financials for this Owner
Home Financials are based on the most recent Mortgage that was taken out on this home.
Original Mortgage
$43,600
Outstanding Balance
$38,728
Interest Rate
2.7%
Mortgage Type
Land Contract Argmt. Of Sale
Estimated Equity
$63,897
Purchase Details
Closed on
Jul 11, 2012
Sold by
Woodridge Investments Group Llc
Bought by
Freestyle Ventures Llc
Purchase Details
Closed on
Jul 26, 2011
Sold by
Pennington Stephen T
Bought by
Wooddridge Investment Group Llc
Create a Home Valuation Report for This Property
The Home Valuation Report is an in-depth analysis detailing your home's value as well as a comparison with similar homes in the area
Home Values in the Area
Average Home Value in this Area
Purchase History
| Date | Buyer | Sale Price | Title Company |
|---|---|---|---|
| Wickliff Douglas | $43,600 | None Available | |
| Freestyle Ventures Llc | $26,624 | None Available | |
| Wooddridge Investment Group Llc | $34,000 | None Available |
Source: Public Records
Mortgage History
| Date | Status | Borrower | Loan Amount |
|---|---|---|---|
| Open | Wickliff Douglas | $43,600 |
Source: Public Records
Tax History Compared to Growth
Tax History
| Year | Tax Paid | Tax Assessment Tax Assessment Total Assessment is a certain percentage of the fair market value that is determined by local assessors to be the total taxable value of land and additions on the property. | Land | Improvement |
|---|---|---|---|---|
| 2024 | $885 | $28,350 | $4,830 | $23,520 |
| 2023 | $1,687 | $23,030 | $4,060 | $18,970 |
| 2022 | $1,677 | $23,030 | $4,060 | $18,970 |
| 2021 | $1,724 | $23,030 | $4,060 | $18,970 |
| 2020 | $1,671 | $19,180 | $3,395 | $15,785 |
| 2019 | $1,618 | $19,180 | $3,395 | $15,785 |
| 2018 | $1,556 | $19,180 | $3,395 | $15,785 |
| 2017 | $1,437 | $17,500 | $5,250 | $12,250 |
| 2016 | $1,437 | $50,000 | $15,000 | $35,000 |
| 2015 | $1,447 | $50,000 | $15,000 | $35,000 |
| 2014 | $1,225 | $17,500 | $5,250 | $12,250 |
| 2013 | $1,225 | $17,500 | $5,250 | $12,250 |
Source: Public Records
Map
Nearby Homes
- 5211 Douglas Rd
- 5338 Amsden Ave
- 2433 Paradise Ave
- 2623 W Laskey Rd
- 2604 Arletta St
- 2341 Wernert Ave
- 4924 Roywood Rd
- 2849 W Laskey Rd
- 5402 Sandra Ct
- 2820 Claredale Rd
- 5117 Fern Dr
- 2336 Murray Dr
- 5530 Douglas Rd
- 2605 Wyndale Rd
- 5201 Elaine Dr
- 5111 Elaine Dr
- 4807 Brott Rd
- 2344 Mellwood Ave
- 2424 Bodette Ave
- 3065 Reen Dr