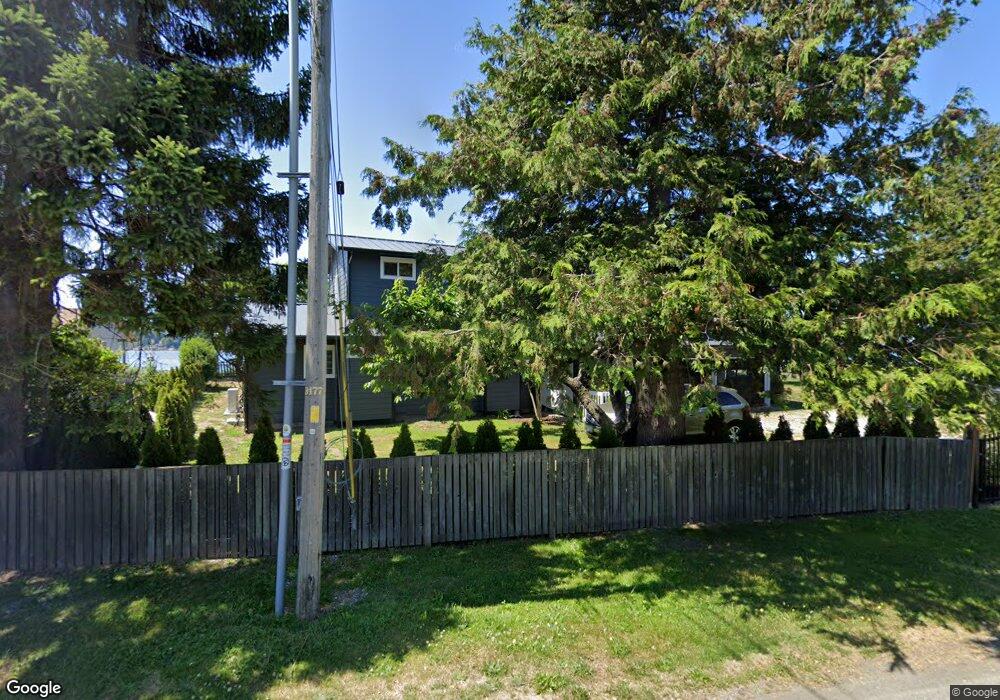
2621 Lummi View Dr Bellingham, WA 98226
Estimated Value: $904,000 - $1,164,518
4
Beds
3
Baths
1,424
Sq Ft
$735/Sq Ft
Est. Value
About This Home
This home is located at 2621 Lummi View Dr, Bellingham, WA 98226 and is currently estimated at $1,047,130, approximately $735 per square foot. 2621 Lummi View Dr is a home located in Whatcom County with nearby schools including Eagleridge Elementary School, Horizon Middle School, and Ferndale High School.
Ownership History
Date
Name
Owned For
Owner Type
Purchase Details
Closed on
Nov 27, 2016
Sold by
Go Long 22 Llc
Bought by
Summers Gregory and Summers Heidi
Current Estimated Value
Home Financials for this Owner
Home Financials are based on the most recent Mortgage that was taken out on this home.
Original Mortgage
$324,000
Interest Rate
3.52%
Mortgage Type
Seller Take Back
Purchase Details
Closed on
Jan 11, 2013
Sold by
Perry Colleen Wylde and White Jane Wylde
Bought by
Golong22 Llc
Purchase Details
Closed on
Feb 23, 2012
Sold by
Jackson James H
Bought by
Perry Colleen Wylde and White Jane Wylde
Purchase Details
Closed on
Jun 14, 2001
Sold by
Wylde Samuel M and Wylde Helen Beatrix
Bought by
Wylde Sam M and Wylde Helen B
Purchase Details
Closed on
Mar 17, 1961
Sold by
Mackenzie Lena
Bought by
Wylde Samuel W and Wylde Helen Beatrix
Create a Home Valuation Report for This Property
The Home Valuation Report is an in-depth analysis detailing your home's value as well as a comparison with similar homes in the area
Home Values in the Area
Average Home Value in this Area
Purchase History
| Date | Buyer | Sale Price | Title Company |
|---|---|---|---|
| Summers Gregory | $360,000 | Chicago Title Insurance | |
| Golong22 Llc | $245,280 | Chicago Title Insurance | |
| Perry Colleen Wylde | -- | None Available | |
| Wylde Sam M | -- | -- | |
| Wylde Samuel W | -- | Washington Title Insurance C |
Source: Public Records
Mortgage History
| Date | Status | Borrower | Loan Amount |
|---|---|---|---|
| Closed | Summers Gregory | $324,000 |
Source: Public Records
Tax History Compared to Growth
Tax History
| Year | Tax Paid | Tax Assessment Tax Assessment Total Assessment is a certain percentage of the fair market value that is determined by local assessors to be the total taxable value of land and additions on the property. | Land | Improvement |
|---|---|---|---|---|
| 2024 | $8,969 | $1,116,854 | $642,239 | $474,615 |
| 2023 | $8,969 | $1,165,943 | $670,474 | $495,469 |
| 2022 | $6,603 | $804,091 | $462,396 | $341,695 |
| 2021 | $7,029 | $669,877 | $409,200 | $260,677 |
| 2020 | $6,775 | $652,244 | $383,869 | $268,375 |
| 2019 | $4,614 | $591,076 | $347,872 | $243,204 |
| 2018 | $5,086 | $458,262 | $316,512 | $141,750 |
| 2017 | $4,454 | $388,976 | $268,576 | $120,400 |
| 2016 | $4,216 | $357,424 | $246,624 | $110,800 |
| 2015 | -- | $352,559 | $259,000 | $93,559 |
| 2014 | -- | $410,476 | $283,500 | $126,976 |
| 2013 | -- | $410,476 | $283,500 | $126,976 |
Source: Public Records
Map
Nearby Homes
- 3455 Velma Rd
- 3456 Emma Rd
- 2625 Lummi View Dr
- 3440 Emma Rd
- 2589 Lummi View Dr
- 2579 Finkbonner Rd
- 2560 Lummi View Dr
- 2552 Lummi View Dr
- 2553 Mackenzie Rd
- 3003 Haxton Way
- 2519 Lummi Shore Rd
- 2155 Postal Ave
- 2798 N Nugent Rd
- 2093 Granger Way
- 2061 Granger Way
- 0 Granger Way Unit NWM2445163
- 3965 Legoe Bay Rd
- 2879 N Nugent Rd Unit H8
- 2877 N Nugent Rd Unit M3
- 2877 N Nugent Rd Unit M4
- 2627 Lummi View Dr
- 2619 Haxton Way
- 2617 Lummi View Dr
- 3480 Emma Rd
- 2629 Lummi View Dr
- 2628 Lummi View Dr
- 3460 Emma Rd
- 3457 Velma Rd
- 2616 Lummi View Dr
- 7 Haxton Way
- 2631 Lummi View Dr
- 2633 Lummi View Dr
- 2615 Haxton Way
- 2632 Lummi View Dr
- 2613 Lummi View Dr
- 2613 Haxton Way
- 3459 Emma Rd
- 2635 Lummi View Dr
- 2612 Lummi View Dr
- 2611 Lummi View Dr