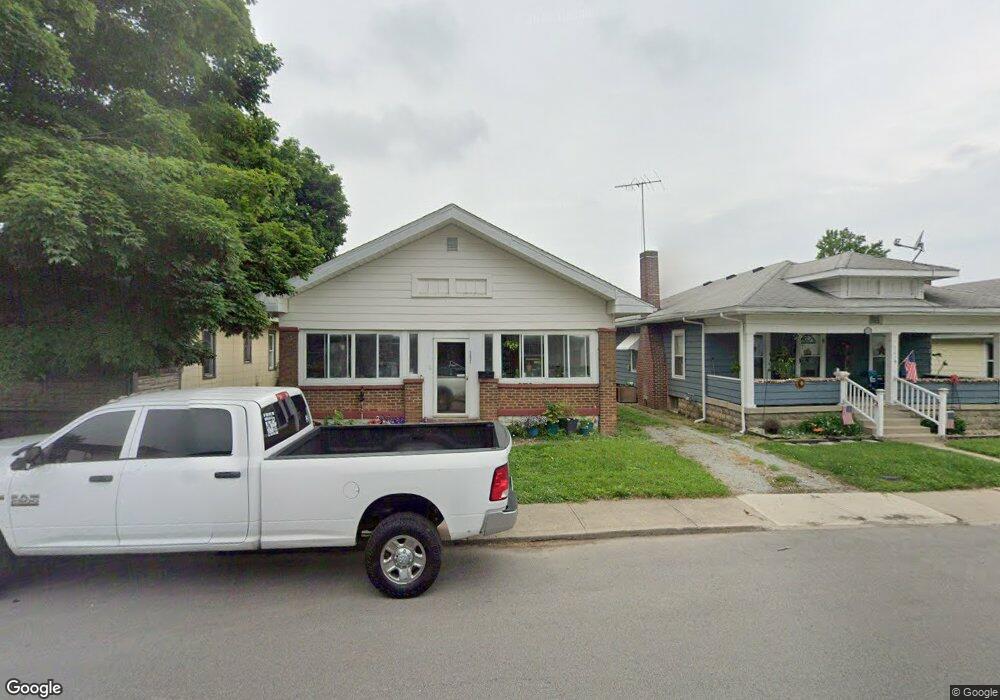
2621 Main St Anderson, IN 46016
Estimated Value: $108,000 - $167,000
3
Beds
1
Bath
1,120
Sq Ft
$131/Sq Ft
Est. Value
About This Home
This home is located at 2621 Main St, Anderson, IN 46016 and is currently estimated at $146,384, approximately $130 per square foot. 2621 Main St is a home located in Madison County with nearby schools including Erskine Elementary School, Highland Middle School, and Anderson High School.
Ownership History
Date
Name
Owned For
Owner Type
Purchase Details
Closed on
Jun 12, 2024
Sold by
Spike Capital Solo 401K Trust and Caraballo Yolanda
Bought by
Harvey Blake A and Harvey Olivia G
Current Estimated Value
Home Financials for this Owner
Home Financials are based on the most recent Mortgage that was taken out on this home.
Original Mortgage
$130,050
Outstanding Balance
$128,229
Interest Rate
7.22%
Mortgage Type
New Conventional
Estimated Equity
$18,155
Purchase Details
Closed on
Sep 27, 2019
Sold by
Madison County Auditor
Bought by
Spike Capital Solo 401K Trust Yolanda Ca
Purchase Details
Closed on
Sep 1, 2011
Sold by
Real Eulalio Magallanes Del
Bought by
Mem Properties Llc
Purchase Details
Closed on
Jul 13, 2007
Sold by
Short Odell D and Short Michelle J
Bought by
Gmac Mortgage Llc
Purchase Details
Closed on
Jul 12, 2007
Sold by
Gmac Mortgage Llc
Bought by
Federal National Mortgage Association
Create a Home Valuation Report for This Property
The Home Valuation Report is an in-depth analysis detailing your home's value as well as a comparison with similar homes in the area
Home Values in the Area
Average Home Value in this Area
Purchase History
| Date | Buyer | Sale Price | Title Company |
|---|---|---|---|
| Harvey Blake A | $153,000 | Absolute Title Inc | |
| Spike Capital Solo 401K Trust Yolanda Ca | $6,800 | None Available | |
| Mem Properties Llc | -- | None Available | |
| Gmac Mortgage Llc | $38,397 | -- | |
| Federal National Mortgage Association | -- | -- |
Source: Public Records
Mortgage History
| Date | Status | Borrower | Loan Amount |
|---|---|---|---|
| Open | Harvey Blake A | $130,050 |
Source: Public Records
Tax History Compared to Growth
Tax History
| Year | Tax Paid | Tax Assessment Tax Assessment Total Assessment is a certain percentage of the fair market value that is determined by local assessors to be the total taxable value of land and additions on the property. | Land | Improvement |
|---|---|---|---|---|
| 2025 | $1,424 | $64,100 | $5,400 | $58,700 |
| 2024 | $1,424 | $64,100 | $5,400 | $58,700 |
| 2023 | $1,306 | $58,400 | $5,200 | $53,200 |
| 2022 | $881 | $39,400 | $5,000 | $34,400 |
| 2021 | $806 | $35,800 | $4,900 | $30,900 |
| 2020 | $770 | $34,100 | $4,700 | $29,400 |
| 2019 | $1,324 | $38,600 | $4,800 | $33,800 |
| 2018 | $3,158 | $35,500 | $4,800 | $30,700 |
| 2017 | $700 | $35,000 | $4,800 | $30,200 |
| 2016 | $1,095 | $35,000 | $4,800 | $30,200 |
| 2014 | $668 | $33,400 | $4,800 | $28,600 |
| 2013 | $668 | $33,400 | $4,800 | $28,600 |
Source: Public Records
Map
Nearby Homes
- 2639 Central Ave
- 2806 Meridian St
- 2519 Jackson St
- 2410 Central Ave
- 2420 Fletcher St
- 2310 Main St
- 2915 Central Ave
- 2328 Fletcher St
- 312 W 29th St
- 2530 Lincoln St
- 2111 Central Ave
- 2122 Fletcher St
- 0 Pearl St
- 2126 Pearl St
- 2122 Pearl St
- 2220 Lincoln St
- 2007 Fletcher St
- 621 E 31st St
- 2234 Fairview St
- 2321 Fairview St