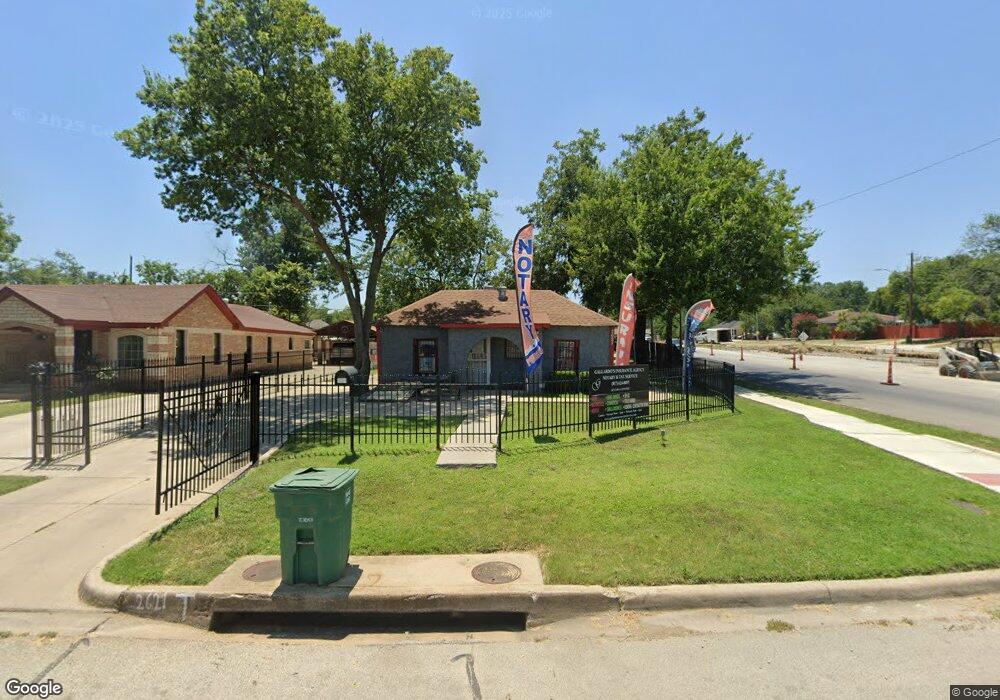
2621 NW 29th St Fort Worth, TX 76106
Northside Neighborhood
1
Bed
2
Baths
904
Sq Ft
7,057
Sq Ft Lot
About This Home
This home is located at 2621 NW 29th St, Fort Worth, TX 76106. 2621 NW 29th St is a home located in Tarrant County with nearby schools including Dolores Huerta Elementary School, Kirkpatrick Middle School, and North Side High School.
Ownership History
Date
Name
Owned For
Owner Type
Purchase Details
Closed on
Oct 20, 2022
Sold by
Pizana Blanca E
Bought by
Gallardo Deborah
Purchase Details
Closed on
Sep 30, 2020
Sold by
Dallas Metro Holdings Llc
Bought by
Laird Jeffrey W and Stockman David
Home Financials for this Owner
Home Financials are based on the most recent Mortgage that was taken out on this home.
Original Mortgage
$127,400
Interest Rate
2.9%
Mortgage Type
Stand Alone First
Purchase Details
Closed on
Jun 19, 2009
Sold by
We Buy Houses
Bought by
Gallardo Salvador and Gallardo Deborah
Purchase Details
Closed on
Apr 2, 2005
Sold by
Traffanstedt Penny Renee
Bought by
We Buy Houses
Purchase Details
Closed on
Jun 16, 1999
Sold by
Evans Carla Ann
Bought by
Traffanstedt Penny Renee
Purchase Details
Closed on
Nov 20, 1994
Sold by
Matthews Martha A
Bought by
Traffanstedt Penny Renee
Create a Home Valuation Report for This Property
The Home Valuation Report is an in-depth analysis detailing your home's value as well as a comparison with similar homes in the area
Home Values in the Area
Average Home Value in this Area
Purchase History
| Date | Buyer | Sale Price | Title Company |
|---|---|---|---|
| Gallardo Deborah | -- | -- | |
| Laird Jeffrey W | -- | None Available | |
| Gallardo Salvador | -- | None Available | |
| We Buy Houses | -- | None Available | |
| Traffanstedt Penny Renee | -- | -- | |
| Traffanstedt Penny Renee | -- | -- |
Source: Public Records
Mortgage History
| Date | Status | Borrower | Loan Amount |
|---|---|---|---|
| Previous Owner | Laird Jeffrey W | $127,400 | |
| Closed | Gallardo Salvador | $0 |
Source: Public Records
Tax History Compared to Growth
Tax History
| Year | Tax Paid | Tax Assessment Tax Assessment Total Assessment is a certain percentage of the fair market value that is determined by local assessors to be the total taxable value of land and additions on the property. | Land | Improvement |
|---|---|---|---|---|
| 2025 | $1,906 | $103,318 | $28,296 | $75,022 |
| 2024 | $1,906 | $84,213 | $28,296 | $55,917 |
| 2023 | $1,906 | $84,213 | $28,296 | $55,917 |
| 2022 | $2,189 | $84,213 | $28,296 | $55,917 |
| 2021 | $2,310 | $84,213 | $28,296 | $55,917 |
| 2020 | $2,229 | $84,213 | $28,296 | $55,917 |
| 2019 | $2,317 | $84,213 | $28,296 | $55,917 |
| 2018 | $2,032 | $73,867 | $28,296 | $45,571 |
| 2017 | $1,797 | $63,440 | $28,296 | $35,144 |
| 2014 | $1,476 | $52,000 | $14,148 | $37,852 |
Source: Public Records
Map
Nearby Homes
- 2517 NW 29th St
- 2717 NW 27th St
- 2705 NW 34th St
- Lot 3B Lake Prarie Trail
- 2713 NW 35th St
- 2719 NW 25th St
- 2907 NW 26th St
- 2707 NW 24th St
- 3009 Columbus Ave
- 2958 Columbus Ave
- 2922 Columbus Ave
- 2919 Columbus Ave
- 2961 Pearl Ave
- 2929 Angle Ave
- 2927 Angle Ave
- 2610 Columbus Ave
- 3203 NW 33rd St
- 2921 Market Ave
- 2500 NW 20th St
- 3214 NW Loraine St
- 2619 NW 29th St
- 2615 NW 29th St
- 2620 NW Loraine St
- 2622 NW Loraine St
- 2616 NW Loraine St
- 2620 NW 29th St
- 2613 NW 29th St
- 2703 NW 29th St
- 2618 NW 29th St
- 2614 NW Loraine St
- 2616 NW 29th St
- 2705 NW 29th St
- 2702 NW Loraine St
- 2612 NW Loraine St
- 2700 NW 29th St
- 1005 NW Loraine St
- 2612 NW 29th St
- 2609 NW 29th St
- 2610 NW Loraine St
- 2704 NW Loraine St