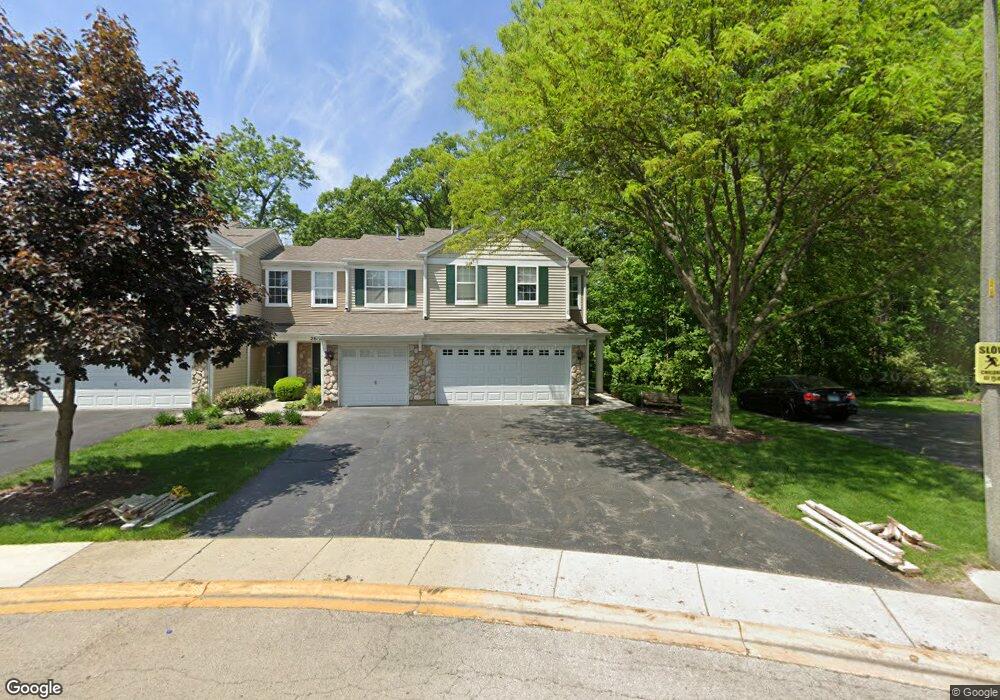
2621 Oak Tree Ln Plainfield, IL 60586
East Plainfield NeighborhoodEstimated Value: $245,000 - $270,781
3
Beds
2
Baths
1,271
Sq Ft
$206/Sq Ft
Est. Value
About This Home
This home is located at 2621 Oak Tree Ln, Plainfield, IL 60586 and is currently estimated at $261,695, approximately $205 per square foot. 2621 Oak Tree Ln is a home located in Will County with nearby schools including River View Elementary School, Timber Ridge Middle School, and Plainfield Central High School.
Ownership History
Date
Name
Owned For
Owner Type
Purchase Details
Closed on
Nov 9, 2005
Sold by
Tomes Kathy
Bought by
Abdelqader Fatimah P
Current Estimated Value
Home Financials for this Owner
Home Financials are based on the most recent Mortgage that was taken out on this home.
Original Mortgage
$136,000
Outstanding Balance
$83,098
Interest Rate
7.99%
Mortgage Type
Purchase Money Mortgage
Estimated Equity
$178,597
Purchase Details
Closed on
Jun 13, 2003
Sold by
Ahlquist Elaine J
Bought by
Tomes Kathy
Home Financials for this Owner
Home Financials are based on the most recent Mortgage that was taken out on this home.
Original Mortgage
$70,000
Interest Rate
6.43%
Mortgage Type
Purchase Money Mortgage
Purchase Details
Closed on
Jun 1, 2000
Sold by
Centex Homes
Bought by
Ahlquist Elaine J
Home Financials for this Owner
Home Financials are based on the most recent Mortgage that was taken out on this home.
Original Mortgage
$62,811
Interest Rate
8.56%
Create a Home Valuation Report for This Property
The Home Valuation Report is an in-depth analysis detailing your home's value as well as a comparison with similar homes in the area
Home Values in the Area
Average Home Value in this Area
Purchase History
| Date | Buyer | Sale Price | Title Company |
|---|---|---|---|
| Abdelqader Fatimah P | $170,000 | -- | |
| Tomes Kathy | $140,500 | Ticor Title | |
| Ahlquist Elaine J | $143,000 | Chicago Title Insurance Co |
Source: Public Records
Mortgage History
| Date | Status | Borrower | Loan Amount |
|---|---|---|---|
| Open | Abdelqader Fatimah P | $136,000 | |
| Previous Owner | Tomes Kathy | $70,000 | |
| Previous Owner | Ahlquist Elaine J | $62,811 |
Source: Public Records
Tax History Compared to Growth
Tax History
| Year | Tax Paid | Tax Assessment Tax Assessment Total Assessment is a certain percentage of the fair market value that is determined by local assessors to be the total taxable value of land and additions on the property. | Land | Improvement |
|---|---|---|---|---|
| 2024 | $4,951 | $77,124 | $13,476 | $63,648 |
| 2023 | $4,951 | $69,657 | $12,171 | $57,486 |
| 2022 | $4,354 | $61,444 | $10,736 | $50,708 |
| 2021 | $4,116 | $57,425 | $10,034 | $47,391 |
| 2020 | $4,048 | $55,795 | $9,749 | $46,046 |
| 2019 | $3,898 | $53,163 | $9,289 | $43,874 |
| 2018 | $3,718 | $49,949 | $8,727 | $41,222 |
| 2017 | $3,288 | $43,905 | $8,293 | $35,612 |
| 2016 | $3,210 | $41,874 | $7,909 | $33,965 |
| 2015 | $3,013 | $39,226 | $7,409 | $31,817 |
| 2014 | $3,013 | $37,841 | $7,147 | $30,694 |
| 2013 | $3,013 | $37,841 | $7,147 | $30,694 |
Source: Public Records
Map
Nearby Homes
- 2421 Lockner Blvd
- 2350 Woodhill Ct
- 2336 Woodhill Ct
- 3806 Brenton Dr
- 3712 Hennepin Dr
- 3812 Hennepin Dr
- 3020 Abbey Cir
- 3005 Abbey Cir
- 23033 Ironwood Dr Unit 3
- 16741 Hazelwood Dr
- 2731 Old Woods Trail Unit 9C
- 4022 Hennepin Dr Unit 171
- 3100 Jo Ann Dr
- 2718 Lake Side Cir
- 3419 Lake Side Cir
- 2205 Rossiter Pkwy Unit 1
- 3032 Woodside Dr Unit 65
- 2167 Rossiter Pkwy
- 3540 Woodside Ct
- 3812 Landings Rd
- 2619 Oak Tree Ln
- 2617 Oak Tree Ln
- 2615 Oak Tree Ln Unit 2
- 4057 Oak Tree Ln
- 4057 Oak Tree Ln Unit 114
- 2613 Oak Tree Ln Unit 2
- 2613 Oak Tree Ln Unit 3
- 4055 Oak Tree Ln Unit 2
- 2611 Oak Tree Ln
- 4053 Oak Tree Ln
- 4051 Oak Tree Ln Unit 2
- 4044 Oak Tree Ln
- 2607 Oak Tree Ln
- 4049 Oak Tree Ln
- 4047 Oak Tree Ln
- 2605 Oak Tree Ln
- 4040 Oak Tree Ln
- 2603 Oak Tree Ln
- 4038 Oak Tree Ln Unit 2
- 4043 Oak Tree Ln