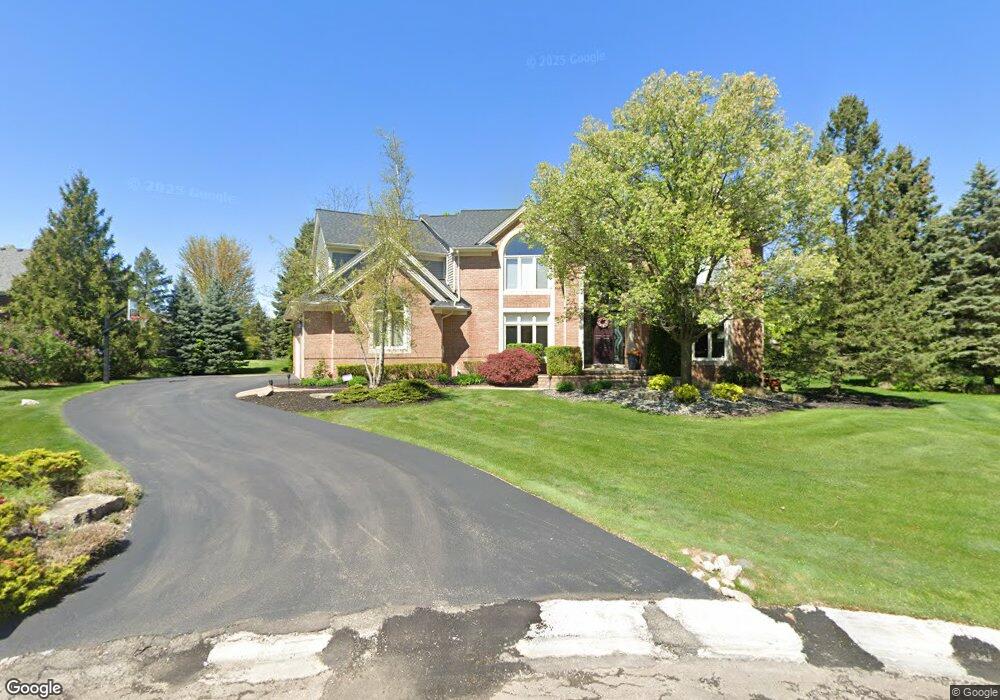
2621 Sequoia Ct Bloomfield Hills, MI 48304
Estimated Value: $981,000 - $2,007,000
4
Beds
6
Baths
4,267
Sq Ft
$334/Sq Ft
Est. Value
About This Home
This home is located at 2621 Sequoia Ct, Bloomfield Hills, MI 48304 and is currently estimated at $1,426,914, approximately $334 per square foot. 2621 Sequoia Ct is a home located in Oakland County with nearby schools including Eastover Elementary School, Bloomfield Hills High School, and Arts & Technology Academy of Pontiac.
Ownership History
Date
Name
Owned For
Owner Type
Purchase Details
Closed on
Oct 20, 2014
Sold by
Desai Snehal R and Desai Sheena T
Bought by
Desai Snehal R and Desai Sheena T
Current Estimated Value
Purchase Details
Closed on
Oct 23, 2009
Sold by
Settecerri Jeffrey J and Settecerri Cynthia A
Bought by
Desai Snehal R and Desai Sheena T
Purchase Details
Closed on
Jan 26, 2007
Sold by
Settecerri Jeffrey J and Settecerri Cynthia A
Bought by
Settecerri Jeffrey J and Settecerri Cynthia A
Home Financials for this Owner
Home Financials are based on the most recent Mortgage that was taken out on this home.
Original Mortgage
$640,500
Interest Rate
6.75%
Mortgage Type
New Conventional
Purchase Details
Closed on
May 30, 2000
Sold by
Pine Ridge Estates
Bought by
Beneicke Group
Create a Home Valuation Report for This Property
The Home Valuation Report is an in-depth analysis detailing your home's value as well as a comparison with similar homes in the area
Home Values in the Area
Average Home Value in this Area
Purchase History
| Date | Buyer | Sale Price | Title Company |
|---|---|---|---|
| Desai Snehal R | -- | None Available | |
| Desai Snehal R | $615,000 | Capital Title Ins Agency | |
| Settecerri Jeffrey J | -- | Complete Title Services | |
| Beneicke Group | $200,000 | -- |
Source: Public Records
Mortgage History
| Date | Status | Borrower | Loan Amount |
|---|---|---|---|
| Previous Owner | Settecerri Jeffrey J | $640,500 |
Source: Public Records
Tax History Compared to Growth
Tax History
| Year | Tax Paid | Tax Assessment Tax Assessment Total Assessment is a certain percentage of the fair market value that is determined by local assessors to be the total taxable value of land and additions on the property. | Land | Improvement |
|---|---|---|---|---|
| 2024 | $6,616 | $465,100 | $0 | $0 |
| 2023 | $6,403 | $410,810 | $0 | $0 |
| 2022 | $12,033 | $393,720 | $0 | $0 |
| 2021 | $11,946 | $393,000 | $0 | $0 |
| 2020 | $5,856 | $383,960 | $0 | $0 |
| 2019 | $11,241 | $373,200 | $0 | $0 |
| 2018 | $11,292 | $379,960 | $0 | $0 |
| 2017 | $11,211 | $370,250 | $0 | $0 |
| 2016 | $11,233 | $367,950 | $0 | $0 |
| 2015 | -- | $340,770 | $0 | $0 |
| 2014 | -- | $316,330 | $0 | $0 |
| 2011 | -- | $305,120 | $0 | $0 |
Source: Public Records
Map
Nearby Homes
- 2615 Warwick Dr
- 700 E Square Lake Rd
- 692 Brockmoor Ln
- 2724 Alveston Dr
- 2625 Plum Brook Dr
- 448 Fox Hills Dr S Unit 3
- 2755 Hunters Hill Rd
- 584 Cambridge Way Unit 522
- 536 Cambridge Way
- 457 Cambridge Way
- 433 Fox Hills Dr S Unit 5
- 723 E Fox Hills Dr Unit X186
- 689 E Fox Hills Dr Unit 65
- 635 E Fox Hills Dr Unit F41
- 654 E Fox Hills Dr
- 667 E Fox Hills Dr Unit H59
- 587 E Fox Hills Dr
- 737 E Fox Hills Dr Unit 180
- 480 Fox Hills Dr N Unit 6
- 454 N Fox Hills Dr Unit A-8
- 546 Brownley Ct
- 2632 Sequoia Ct Unit Bldg-Unit
- 2632 Sequoia Ct
- 550 Reynard Ct
- 2605 Sequoia Ct
- 532 Brownley Ct
- 565 Foxhall Ct
- 560 Brownley Ct
- 2618 Sequoia Ct
- 2604 Sequoia Ct
- 566 Reynard Ct
- 2591 Sequoia Ct
- 581 Foxhall Ct
- 567 Reynard Ct
- 518 Brownley Ct
- 545 Brownley Ct
- 2590 Sequoia Ct
- 551 Reynard Ct
- 533 Brownley Ct
- 2643 Hunters Bluff