2621 Viking Dr Unit 2332330-368 Herndon, VA 20171
Oak Hill NeighborhoodEstimated Value: $776,000 - $918,000
4
Beds
3
Baths
1,800
Sq Ft
$463/Sq Ft
Est. Value
About This Home
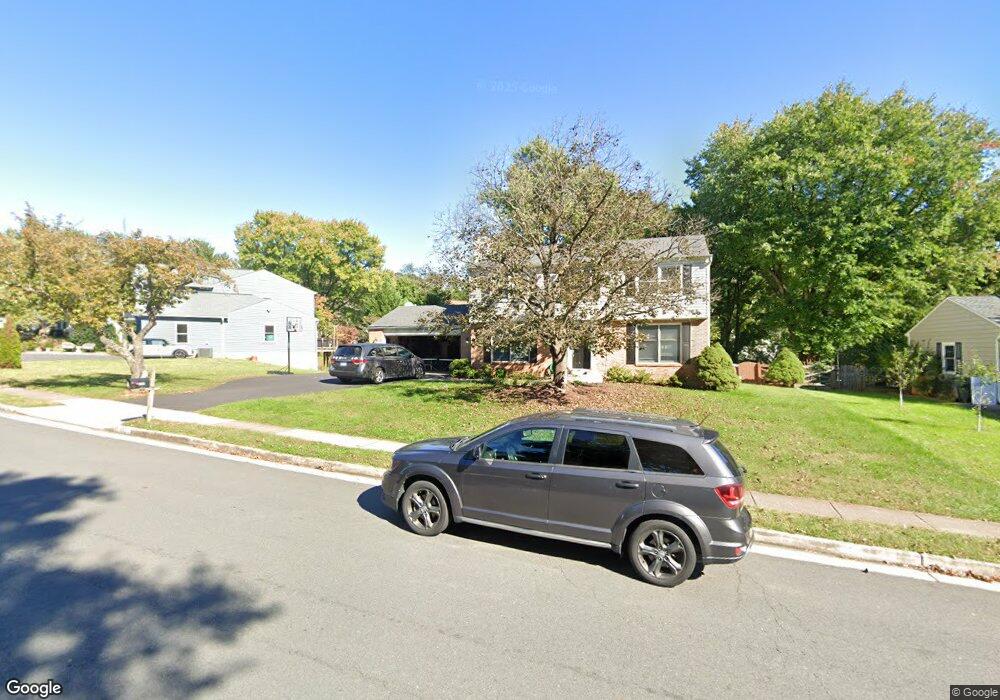
This home is located at 2621 Viking Dr Unit 2332330-368, Herndon, VA 20171 and is currently estimated at $832,896, approximately $462 per square foot. 2621 Viking Dr Unit 2332330-368 is a home located in Fairfax County with nearby schools including Fox Mill Elementary School, Rachel Carson Middle School, and South Lakes High School.
Ownership History
Date
Name
Owned For
Owner Type
Purchase Details
Closed on
Sep 19, 2014
Sold by
Brackett Robert E
Bought by
Harris Brian C
Current Estimated Value
Home Financials for this Owner
Home Financials are based on the most recent Mortgage that was taken out on this home.
Original Mortgage
$554,766
Outstanding Balance
$420,432
Interest Rate
3.87%
Mortgage Type
FHA
Estimated Equity
$412,464
Purchase Details
Closed on
Aug 15, 2000
Sold by
Walker Robert H
Bought by
Brackett Robert E
Home Financials for this Owner
Home Financials are based on the most recent Mortgage that was taken out on this home.
Original Mortgage
$211,408
Interest Rate
8.21%
Purchase Details
Closed on
Jul 14, 1997
Sold by
Conklin J Jay J and Conklin Margaret M
Bought by
Walker Robert H and Walker Tonya I
Home Financials for this Owner
Home Financials are based on the most recent Mortgage that was taken out on this home.
Original Mortgage
$174,300
Interest Rate
7.86%
Mortgage Type
New Conventional
Create a Home Valuation Report for This Property
The Home Valuation Report is an in-depth analysis detailing your home's value as well as a comparison with similar homes in the area
Home Values in the Area
Average Home Value in this Area
Purchase History
| Date | Buyer | Sale Price | Title Company |
|---|---|---|---|
| Harris Brian C | $565,000 | -- | |
| Brackett Robert E | $264,260 | -- | |
| Walker Robert H | $183,500 | -- |
Source: Public Records
Mortgage History
| Date | Status | Borrower | Loan Amount |
|---|---|---|---|
| Open | Harris Brian C | $554,766 | |
| Previous Owner | Brackett Robert E | $211,408 | |
| Previous Owner | Walker Robert H | $174,300 |
Source: Public Records
Tax History Compared to Growth
Tax History
| Year | Tax Paid | Tax Assessment Tax Assessment Total Assessment is a certain percentage of the fair market value that is determined by local assessors to be the total taxable value of land and additions on the property. | Land | Improvement |
|---|---|---|---|---|
| 2025 | $8,012 | $769,020 | $310,000 | $459,020 |
| 2024 | $8,012 | $691,580 | $285,000 | $406,580 |
| 2023 | $7,708 | $683,020 | $285,000 | $398,020 |
| 2022 | $7,316 | $639,760 | $255,000 | $384,760 |
| 2021 | $6,730 | $573,510 | $220,000 | $353,510 |
| 2020 | $6,519 | $550,860 | $220,000 | $330,860 |
| 2019 | $6,521 | $551,030 | $220,000 | $331,030 |
| 2018 | $5,972 | $519,320 | $210,000 | $309,320 |
| 2017 | $5,790 | $498,720 | $210,000 | $288,720 |
| 2016 | $5,715 | $493,350 | $210,000 | $283,350 |
| 2015 | $5,718 | $512,350 | $210,000 | $302,350 |
| 2014 | $5,400 | $484,950 | $205,000 | $279,950 |
Source: Public Records
Map
Nearby Homes
- 12703 Carlsbad Ct
- 12732 Bradwell Rd
- 2785 Prince Harold Ct
- 2653 Fanieul Hall Ct
- 2953 Brook Mill Ct
- 12527 Chasbarb Terrace
- 12817 Framingham Ct
- 12436 Wendell Holmes Rd
- 2755 Viking Dr
- 2484 Freetown Dr
- 2725 Robaleed Way
- 2657 Chiswell Place
- 2700 Reign St
- 2510 Freetown Dr
- 12626 Holkein Dr
- 12399 Brown Fox Way
- 12492 Fox View Way
- 13017 New Parkland Dr
- 12902 Tarragon Ct
- 2736 Calkins Rd
- 2621 Viking Dr
- 2623 Viking Dr
- 2623 Viking Dr Unit 2349098-368
- 2619 Viking Dr
- 2619 Viking Dr Unit 2332329-368
- 2631 Puritan Ct
- 2627 Puritan Ct
- 2625 Viking Dr
- 2620 Viking Dr
- 2623 Puritan Ct
- 2618 Viking Dr
- 2625 Puritan Ct
- 12796 Bradwell Rd
- 2627 Viking Dr
- 2616 Viking Dr
- 2613 Viking Dr
- 2621 Puritan Ct
- 2632 Puritan Ct
- 12795 Bradwell Rd
- 2630 Puritan Ct