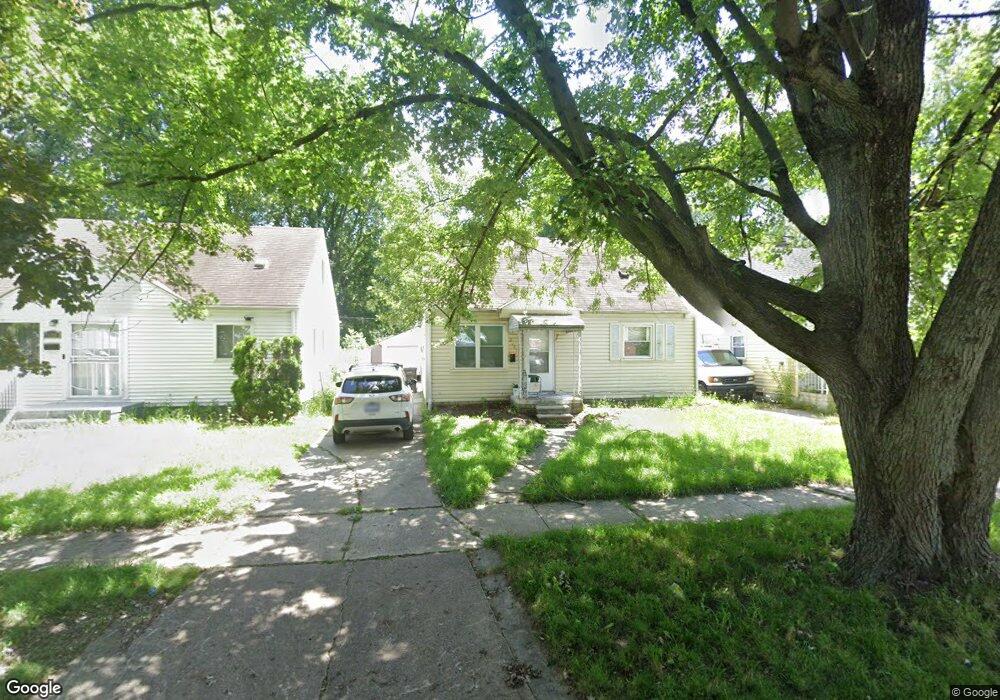
26211 Colgate St Unit Bldg-Unit Inkster, MI 48141
Estimated Value: $88,000 - $112,000
--
Bed
1
Bath
1,126
Sq Ft
$91/Sq Ft
Est. Value
About This Home
This home is located at 26211 Colgate St Unit Bldg-Unit, Inkster, MI 48141 and is currently estimated at $102,376, approximately $90 per square foot. 26211 Colgate St Unit Bldg-Unit is a home located in Wayne County with nearby schools including West Village Academy and Peterson-Warren Academy.
Ownership History
Date
Name
Owned For
Owner Type
Purchase Details
Closed on
Jan 11, 2021
Sold by
Ja Allen Llc
Bought by
Norman Holston
Current Estimated Value
Purchase Details
Closed on
Apr 27, 2018
Sold by
The Peace Of Mind Management Inc
Bought by
Ja Allen Llc
Purchase Details
Closed on
Aug 2, 2016
Sold by
Sunny Capital Group Inc
Bought by
Peace Of Mind Property Management Inc
Purchase Details
Closed on
Jul 12, 2016
Sold by
Rendles Development Group
Bought by
Sunny Capital Group Inc
Purchase Details
Closed on
Feb 11, 2015
Sold by
Goodwin Stacey
Bought by
Rendles Development Group
Purchase Details
Closed on
Aug 14, 2014
Sold by
Rendles Derrick
Bought by
Goodwin Stacey
Purchase Details
Closed on
Jun 9, 2010
Sold by
Lavender Thomas J and Lavender Anna M
Bought by
Federal National Mortgage Association
Create a Home Valuation Report for This Property
The Home Valuation Report is an in-depth analysis detailing your home's value as well as a comparison with similar homes in the area
Home Values in the Area
Average Home Value in this Area
Purchase History
| Date | Buyer | Sale Price | Title Company |
|---|---|---|---|
| Norman Holston | $59,700 | V1 Title Agency | |
| Ja Allen Llc | $17,000 | Embassy Title Agency Inc | |
| Peace Of Mind Property Management Inc | $25,000 | Regions Title Agency Llc | |
| Sunny Capital Group Inc | -- | Regions Title | |
| Rendles Development Group | -- | None Available | |
| Goodwin Stacey | $2,500 | None Available | |
| Federal National Mortgage Association | $53,412 | None Available |
Source: Public Records
Tax History Compared to Growth
Tax History
| Year | Tax Paid | Tax Assessment Tax Assessment Total Assessment is a certain percentage of the fair market value that is determined by local assessors to be the total taxable value of land and additions on the property. | Land | Improvement |
|---|---|---|---|---|
| 2025 | $1,475 | $43,400 | $0 | $0 |
| 2024 | $1,475 | $35,000 | $0 | $0 |
| 2023 | $1,268 | $27,900 | $0 | $0 |
| 2022 | $1,605 | $22,400 | $0 | $0 |
| 2021 | $1,193 | $20,200 | $0 | $0 |
| 2020 | $2,041 | $17,100 | $0 | $0 |
| 2019 | $1,383 | $14,700 | $0 | $0 |
| 2018 | $860 | $13,500 | $0 | $0 |
| 2017 | $709 | $13,000 | $0 | $0 |
| 2016 | $1,259 | $13,200 | $0 | $0 |
| 2015 | $1,740 | $17,400 | $0 | $0 |
| 2013 | $2,190 | $21,900 | $0 | $0 |
| 2012 | $933 | $24,100 | $1,700 | $22,400 |
Source: Public Records
Map
Nearby Homes
- 26202 Colgate St
- 26231 Andover St
- 26159 Stanford St
- 4110 John Daly St
- 26458 Hopkins St
- 26439 Hopkins St
- 25866 Andover St
- 0000 Ross Ross St
- 26419 Carlysle St
- 26225 McDonald St
- 26773 Colgate St
- 26653 Ross St
- 25895 Annapolis St
- 26206 Kitch St
- 26860 Andover St
- 26916 Andover St
- 4863 Glenis St
- 26106 Powers Ave
- 27022 Colgate St
- 26532 Powers Ave
- 26211 Colgate St
- 26215 Colgate St
- 26207 Colgate St
- 26219 Colgate St
- 26203 Colgate St
- 26223 Colgate St
- 26195 Colgate St
- 26224 Stanford St
- 26232 Stanford St
- 26227 Colgate St
- 26240 Stanford St
- 26187 Colgate St
- 26208 Stanford St
- 26248 Stanford St
- 26200 Stanford St
- 26212 Colgate St
- 26208 Colgate St
- 26179 Colgate St
- 26237 Colgate St
- 26256 Stanford St