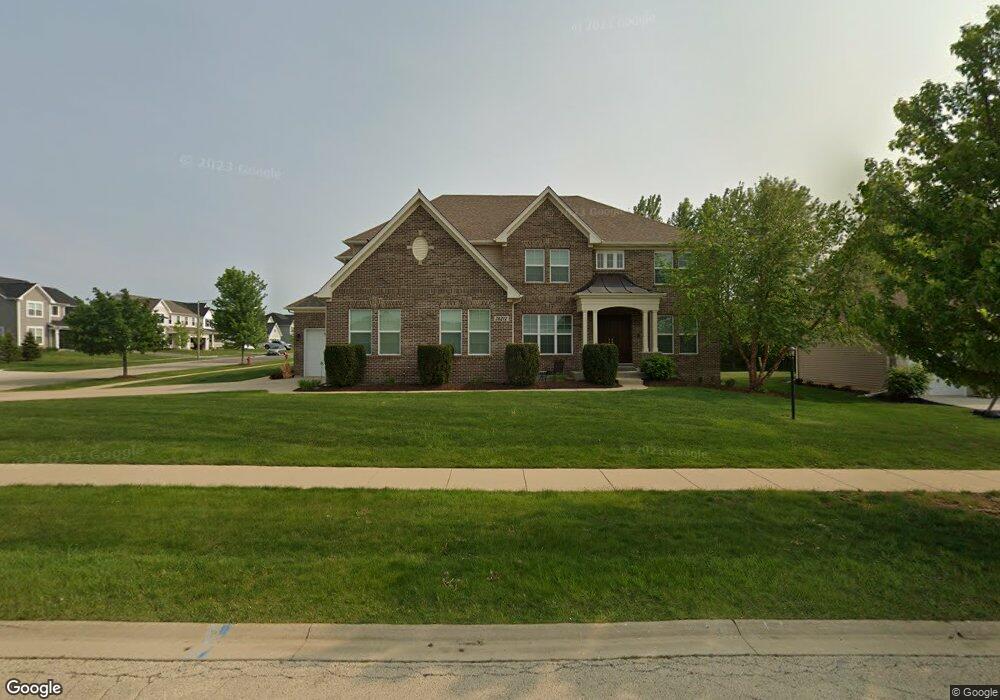
26212 W Baxter Ct Plainfield, IL 60585
Estimated Value: $621,000 - $1,238,000
--
Bed
1
Bath
4,429
Sq Ft
$209/Sq Ft
Est. Value
About This Home
This home is located at 26212 W Baxter Ct, Plainfield, IL 60585 and is currently estimated at $926,028, approximately $209 per square foot. 26212 W Baxter Ct is a home with nearby schools including Grande Park Elementary School, Murphy Junior High School, and Oswego East High School.
Ownership History
Date
Name
Owned For
Owner Type
Purchase Details
Closed on
Sep 2, 2016
Sold by
Bucek Kimberly A and Leonard George E
Bought by
Bucek Kimberly A and Leonard George E
Current Estimated Value
Home Financials for this Owner
Home Financials are based on the most recent Mortgage that was taken out on this home.
Original Mortgage
$480,000
Outstanding Balance
$378,018
Interest Rate
3%
Mortgage Type
Adjustable Rate Mortgage/ARM
Estimated Equity
$548,010
Purchase Details
Closed on
Sep 30, 2011
Sold by
D J K Custom Homes Inc
Bought by
Bucek Kimberly A
Home Financials for this Owner
Home Financials are based on the most recent Mortgage that was taken out on this home.
Original Mortgage
$417,000
Interest Rate
4.22%
Mortgage Type
New Conventional
Purchase Details
Closed on
Feb 8, 2011
Sold by
Lksr Acquisition Llc
Bought by
Djk Custom Homes Inc
Purchase Details
Closed on
Jun 22, 2010
Sold by
Restoration Asset Management Llc
Bought by
Lksr Acquisition Llc
Create a Home Valuation Report for This Property
The Home Valuation Report is an in-depth analysis detailing your home's value as well as a comparison with similar homes in the area
Home Values in the Area
Average Home Value in this Area
Purchase History
| Date | Buyer | Sale Price | Title Company |
|---|---|---|---|
| Bucek Kimberly A | -- | Boston National Title Llc | |
| Bucek Kimberly A | $687,313 | None Available | |
| Djk Custom Homes Inc | $50,000 | Fidelity Natl Title Ins Co | |
| Lksr Acquisition Llc | $580,000 | Chicago Title Insurance Co |
Source: Public Records
Mortgage History
| Date | Status | Borrower | Loan Amount |
|---|---|---|---|
| Open | Bucek Kimberly A | $480,000 | |
| Closed | Bucek Kimberly A | $417,000 |
Source: Public Records
Tax History Compared to Growth
Tax History
| Year | Tax Paid | Tax Assessment Tax Assessment Total Assessment is a certain percentage of the fair market value that is determined by local assessors to be the total taxable value of land and additions on the property. | Land | Improvement |
|---|---|---|---|---|
| 2024 | $25,320 | $332,381 | $34,416 | $297,965 |
| 2023 | $25,320 | $293,623 | $30,403 | $263,220 |
| 2022 | $23,699 | $272,640 | $28,761 | $243,879 |
| 2021 | $24,033 | $259,657 | $27,391 | $232,266 |
| 2020 | $22,697 | $255,543 | $26,957 | $228,586 |
| 2019 | $22,913 | $248,341 | $26,197 | $222,144 |
| 2018 | $21,879 | $227,323 | $25,621 | $201,702 |
| 2017 | $20,251 | $210,384 | $24,959 | $185,425 |
| 2016 | $19,006 | $193,544 | $24,422 | $169,122 |
| 2015 | $21,459 | $186,100 | $23,483 | $162,617 |
| 2014 | $21,459 | $200,350 | $14,340 | $186,010 |
| 2013 | $21,459 | $200,350 | $14,340 | $186,010 |
Source: Public Records
Map
Nearby Homes
- 12305 S Prairie Ridge Ln
- 26205 Forrester Dr
- 26207 Baxter Dr
- 26310 W Baxter Dr
- 26327 Baxter Dr
- 12205 Sinclair Dr
- 12354 S Blue Water Pkwy
- 26205 Stewart Ridge Dr
- 26101 Forrester Dr
- 26005 W Forrester Dr
- 10.38 acres Heggs Rd
- 12501 S Willowgate Ln
- 26200 W Chatham Dr
- 26543 W Countryside Ln
- 26315 Elizabeth Ct
- 26002 W 119th St
- 25734 Galway Ave
- 15 Julie Ct
- 6309 Julie Ct
- 6310 Julie Ct
- 26208 W Baxter Ct
- 12300 S Prairie Ridge Ln
- 26300 W Baxter Dr
- 26204 Baxter Ct
- 12304 S Prairie Ridge Ln
- 26301 W Baxter Dr
- 26200 Baxter Ct
- 26207 W Baxter Ct
- 26302 W Baxter Dr
- 26203 W Baxter Ct
- 12309 S Prairie Ridge Ln
- 26305 W Baxter Dr
- 12312 S Prairie Ridge Ln
- 12313 S Prairie Ridge Lot #116 Ln
- 26313 W Cameron Ct
- 26313 W Cameron Ct
- 12311 S Prairie Ridge Lot #117 Ln
- 26304 W Baxter Dr
- 26309 W Cameron Ct
- 26317 W Cameron Ct