2622 32nd St Unit Rear Lubbock, TX 79410
Tech Terrace (UNIT) NeighborhoodHighlights
- Luxury Vinyl Tile Flooring
- Dogs and Cats Allowed
- 1-Story Property
- Wilson Elementary School Rated A
About This Home
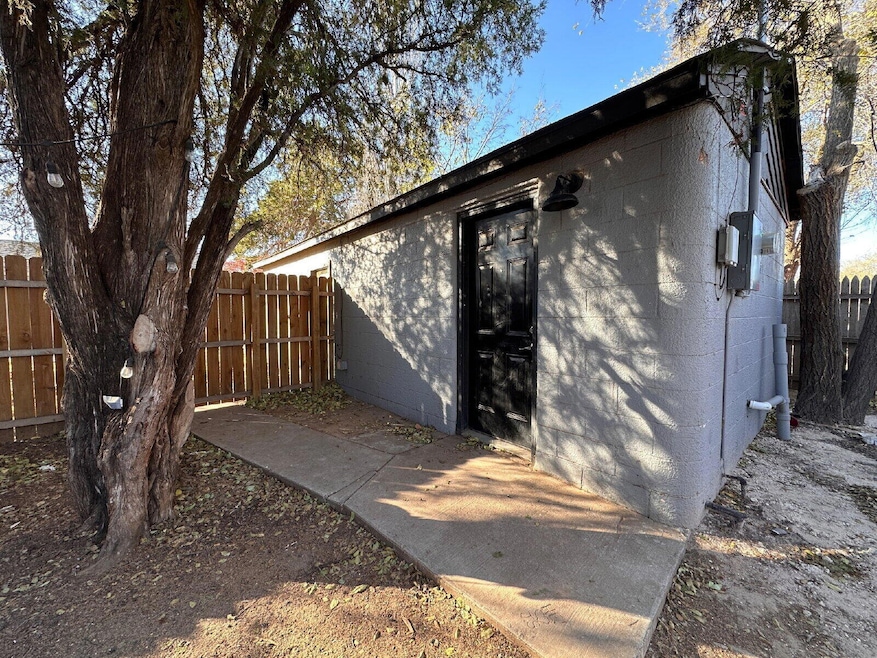
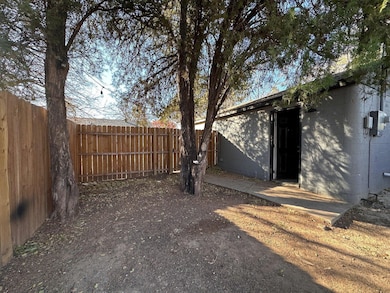
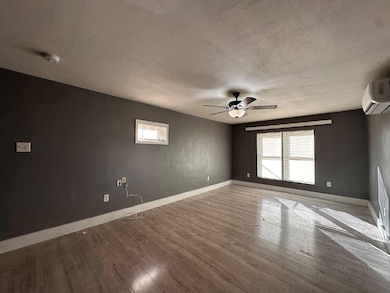
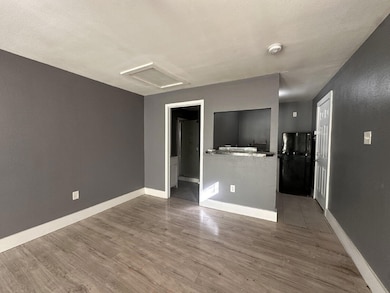
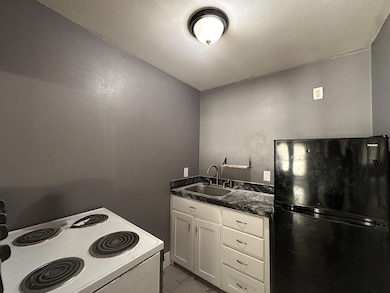
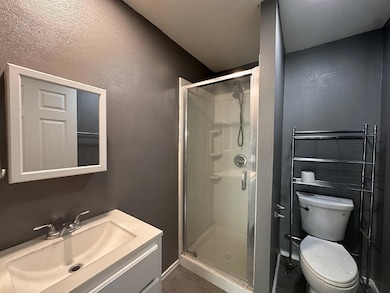
Tech Terrace Living Made Easy Welcome to this updated 1-bedroom, 1-bath unit! Featuring stylish vinyl plank flooring throughout. The kitchen is well-equipped with all the essentials and modern granite-style countertops. The spacious bedroom is filled with natural light from a large window, creating an open and inviting feel. The bathroom has tile finishes and a walk-in shower. To top it off, enjoy your own private, fenced backyard! All Electric. Water is allocated. FLEXIBLE LEASE TERMS AVAILABLE. Pets Considered (1 small @ $300 pet deposit) Schools: Wilson Elementary, Hutchinson Middle School, & Lubbock High School
Home Details
Home Type
- Single Family
Year Built
- Built in 1948
Lot Details
- 9,100 Sq Ft Lot
Parking
- Assigned Parking
Interior Spaces
- 335 Sq Ft Home
- 1-Story Property
- Luxury Vinyl Tile Flooring
- Electric Range
Bedrooms and Bathrooms
- 1 Bedroom
- 1 Full Bathroom
Community Details
- Pets up to 40 lbs
- Pet Size Limit
- Pet Deposit $300
- Dogs and Cats Allowed
Listing and Financial Details
- Assessor Parcel Number R52074
Map
Property History
| Date | Event | Price | List to Sale | Price per Sq Ft |
|---|---|---|---|---|
| 12/11/2025 12/11/25 | For Rent | $650 | -- | -- |
Source: Lubbock Association of REALTORS®
MLS Number: 202564017
APN: R52074
Disclaimer: Certain information contained herein is derived from information provided by parties other than Homes.com. All information provided is deemed reliable, but is not guaranteed to be accurate and should be independently verified.
![]() IDX information is provided exclusively for personal, non-commercial use, and may not be used for any purpose other than to identify prospective properties consumers may be interested in purchasing.
IDX information is provided exclusively for personal, non-commercial use, and may not be used for any purpose other than to identify prospective properties consumers may be interested in purchasing.
Information is deemed reliable but not guaranteed.
