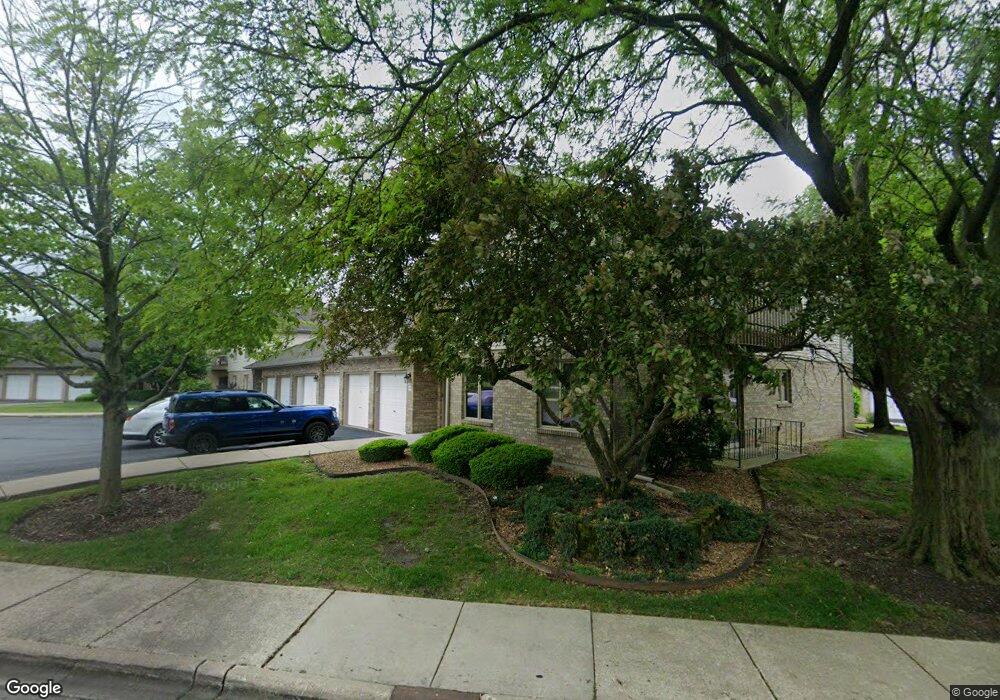
2622 Crescenzo Dr Unit D Joliet, IL 60436
Southwest Joliet NeighborhoodEstimated Value: $207,335 - $240,000
2
Beds
2
Baths
1,325
Sq Ft
$165/Sq Ft
Est. Value
About This Home
This home is located at 2622 Crescenzo Dr Unit D, Joliet, IL 60436 and is currently estimated at $218,584, approximately $164 per square foot. 2622 Crescenzo Dr Unit D is a home located in Will County with nearby schools including Heritage Trail Elementary School, Troy Middle School, and Orenic Intermediate School.
Ownership History
Date
Name
Owned For
Owner Type
Purchase Details
Closed on
Oct 2, 2009
Sold by
Paap Remco
Bought by
Zimmer Bart R
Current Estimated Value
Home Financials for this Owner
Home Financials are based on the most recent Mortgage that was taken out on this home.
Original Mortgage
$94,000
Outstanding Balance
$61,443
Interest Rate
5.1%
Mortgage Type
New Conventional
Estimated Equity
$157,141
Purchase Details
Closed on
Aug 25, 2003
Sold by
Welch Richard J and Welch Mary T
Bought by
Paap Remco
Home Financials for this Owner
Home Financials are based on the most recent Mortgage that was taken out on this home.
Original Mortgage
$93,500
Interest Rate
4.12%
Mortgage Type
Purchase Money Mortgage
Purchase Details
Closed on
Jun 15, 2001
Sold by
Roge Patricia S
Bought by
Welch Richard J and Welch Mary T
Home Financials for this Owner
Home Financials are based on the most recent Mortgage that was taken out on this home.
Original Mortgage
$73,200
Interest Rate
7.23%
Create a Home Valuation Report for This Property
The Home Valuation Report is an in-depth analysis detailing your home's value as well as a comparison with similar homes in the area
Home Values in the Area
Average Home Value in this Area
Purchase History
| Date | Buyer | Sale Price | Title Company |
|---|---|---|---|
| Zimmer Bart R | $117,500 | Republic Title Company | |
| Paap Remco | $117,000 | Ticor Title | |
| Welch Richard J | $91,500 | -- |
Source: Public Records
Mortgage History
| Date | Status | Borrower | Loan Amount |
|---|---|---|---|
| Open | Zimmer Bart R | $94,000 | |
| Previous Owner | Paap Remco | $93,500 | |
| Previous Owner | Welch Richard J | $73,200 | |
| Closed | Welch Richard J | $13,700 |
Source: Public Records
Tax History Compared to Growth
Tax History
| Year | Tax Paid | Tax Assessment Tax Assessment Total Assessment is a certain percentage of the fair market value that is determined by local assessors to be the total taxable value of land and additions on the property. | Land | Improvement |
|---|---|---|---|---|
| 2024 | $4,339 | $57,426 | $9,350 | $48,076 |
| 2023 | $4,339 | $51,596 | $8,401 | $43,195 |
| 2022 | $3,996 | $45,970 | $7,949 | $38,021 |
| 2021 | $3,461 | $43,246 | $7,478 | $35,768 |
| 2020 | $3,241 | $40,838 | $7,478 | $33,360 |
| 2019 | $3,131 | $39,173 | $7,173 | $32,000 |
| 2018 | $2,585 | $32,573 | $7,173 | $25,400 |
| 2017 | $2,538 | $31,593 | $7,173 | $24,420 |
| 2016 | $2,632 | $31,593 | $7,173 | $24,420 |
| 2015 | $2,796 | $31,073 | $7,173 | $23,900 |
| 2014 | $2,796 | $25,000 | $7,173 | $17,827 |
| 2013 | $2,796 | $33,773 | $7,173 | $26,600 |
Source: Public Records
Map
Nearby Homes
- 2632 Crescenzo Dr
- 2628 Eagle Dr Unit 2628
- 2670 Jodee Dr Unit B
- 2689 Jodee Dr Unit B
- 2365 W Jefferson St
- 2300 Webster Ave
- 2604 Caddy Ln
- 305 Saint Jude Ave
- 574 Spring Leaf Dr
- 116 Saint Jude Ave
- 260 Crabapple Dr
- 222 Madison St Unit 404
- 222 Madison St Unit 208
- 222 Madison St Unit 508
- 218 Madison St Unit 1C
- 220 Madison St Unit 1C
- 509 Kungs Way
- 2319 Taylor St
- 601 Fairlane Dr
- 914 Greenleaf Dr
- 2618 Crescenzo Dr Unit 2B
- 2624 Crescenzo Dr Unit 2E
- 2616 Crescenzo Dr Unit A2
- 2616 Crescenzo Dr Unit 2616
- 2620 Crescenzo Dr Unit 2
- 2620 Crescenzo Dr Unit 3
- 2620 Crescenzo Dr Unit C
- 2634 Crescenzo Dr
- 2632 Crescenzo Dr Unit 2632
- 2636 Crescenzo Dr Unit 3C
- 2636 Crescenzo Dr Unit C
- 2608 Crescenzo Dr
- 2610 Crescenzo Dr Unit 1F
- 2638 Crescenzo Dr Unit D
- 2642 Crescenzo Dr Unit 3F
- 2640 Crescenzo Dr Unit 3E
- 2606 Crescenzo Dr Unit D
- 2606 Crescenzo Dr Unit D
- 2615 Par Four Ln Unit 2
- 2617 Par Four Ln Unit 3