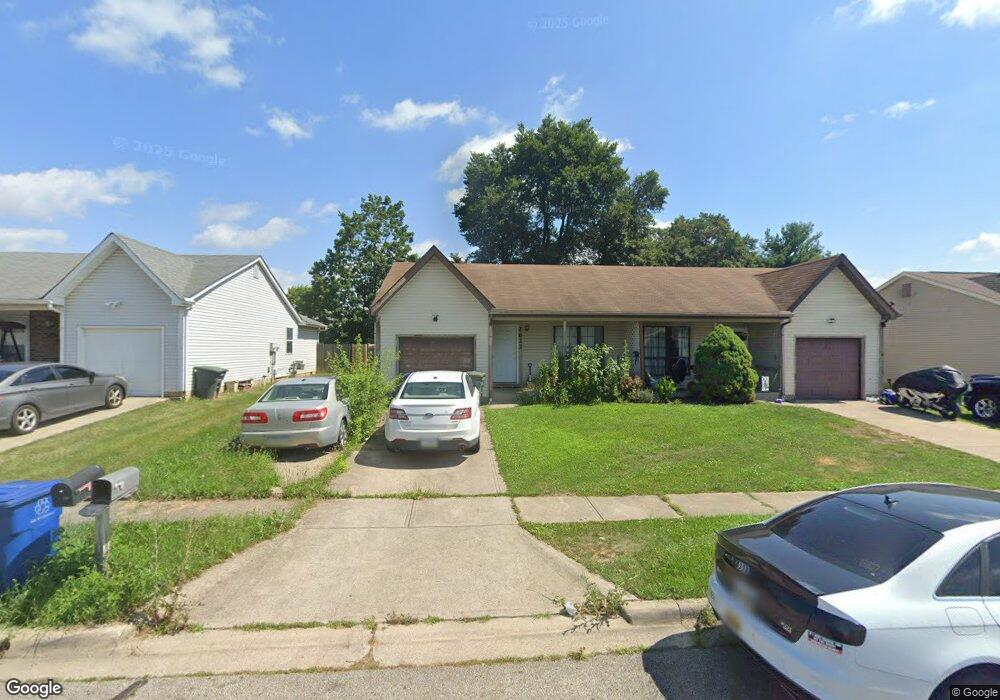
2622 Four Seasons Dr Unit 624 Columbus, OH 43207
Obetz-Lockbourne NeighborhoodEstimated Value: $247,000 - $277,000
6
Beds
2
Baths
1,896
Sq Ft
$140/Sq Ft
Est. Value
About This Home
This home is located at 2622 Four Seasons Dr Unit 624, Columbus, OH 43207 and is currently estimated at $265,805, approximately $140 per square foot. 2622 Four Seasons Dr Unit 624 is a home located in Franklin County with nearby schools including Groveport Madison High School, South Columbus Preparatory Academy at Southfield, and South Scioto Academy.
Ownership History
Date
Name
Owned For
Owner Type
Purchase Details
Closed on
Apr 13, 2007
Sold by
Wray Robert R and Estate Of Robert R Wray
Bought by
Currens Richard W
Current Estimated Value
Home Financials for this Owner
Home Financials are based on the most recent Mortgage that was taken out on this home.
Original Mortgage
$103,500
Interest Rate
6.18%
Mortgage Type
Purchase Money Mortgage
Purchase Details
Closed on
Oct 4, 2002
Sold by
Ryland Cheryl L
Bought by
Wray Robert R
Home Financials for this Owner
Home Financials are based on the most recent Mortgage that was taken out on this home.
Original Mortgage
$108,300
Interest Rate
6.24%
Mortgage Type
Purchase Money Mortgage
Purchase Details
Closed on
Apr 3, 1995
Sold by
Reinstetle Harold N
Bought by
Cheryl L Ryland
Purchase Details
Closed on
Mar 27, 1989
Purchase Details
Closed on
Nov 17, 1988
Create a Home Valuation Report for This Property
The Home Valuation Report is an in-depth analysis detailing your home's value as well as a comparison with similar homes in the area
Home Values in the Area
Average Home Value in this Area
Purchase History
| Date | Buyer | Sale Price | Title Company |
|---|---|---|---|
| Currens Richard W | $115,000 | Chicago Title | |
| Wray Robert R | $114,000 | Title First Agency Inc | |
| Cheryl L Ryland | $103,500 | -- | |
| -- | $92,500 | -- | |
| -- | $10,500 | -- |
Source: Public Records
Mortgage History
| Date | Status | Borrower | Loan Amount |
|---|---|---|---|
| Closed | Currens Richard W | $103,500 | |
| Previous Owner | Wray Robert R | $108,300 | |
| Closed | Cheryl L Ryland | $0 |
Source: Public Records
Tax History Compared to Growth
Tax History
| Year | Tax Paid | Tax Assessment Tax Assessment Total Assessment is a certain percentage of the fair market value that is determined by local assessors to be the total taxable value of land and additions on the property. | Land | Improvement |
|---|---|---|---|---|
| 2024 | $3,696 | $85,160 | $19,250 | $65,910 |
| 2023 | $3,662 | $85,155 | $19,250 | $65,905 |
| 2022 | $1,312 | $25,380 | $7,250 | $18,130 |
| 2021 | $1,316 | $25,380 | $7,250 | $18,130 |
| 2020 | $1,318 | $25,380 | $7,250 | $18,130 |
| 2019 | $1,281 | $22,050 | $6,300 | $15,750 |
| 2018 | $1,678 | $22,050 | $6,300 | $15,750 |
| 2017 | $1,669 | $22,050 | $6,300 | $15,750 |
| 2016 | $2,045 | $30,420 | $6,300 | $24,120 |
| 2015 | $2,067 | $30,420 | $6,300 | $24,120 |
| 2014 | $1,996 | $30,420 | $6,300 | $24,120 |
| 2013 | $928 | $31,990 | $6,615 | $25,375 |
Source: Public Records
Map
Nearby Homes
- 2585 Millview Dr
- 0 Alum Creek Dr Unit 225007823
- 3865 Pendent Ln
- 2318 Rodger Rd
- 2587 Winningwillow Dr
- 2229 Maureen Blvd N
- 2222 Maureen Blvd S
- 4310 Charlotte Rd
- 3724 Revolutionary Dr Unit 111
- 3622 Pendent Ln
- 2629 Patrick Henry Ave Unit 40
- 2697 Meigs Dr
- 2693 Meigs Dr
- 2689 Meigs Dr
- 2685 Meigs Dr
- 2681 Meigs Dr
- 3242 Mackinac Dr
- 2686 Meigs Dr
- 2690 Meigs Dr
- 2682 Meigs Dr
- 2622 Four Seasons
- 2630 Four Seasons Dr Unit 632
- 2614 Four Seasons Dr
- 4136 Springtime Ct
- 4137 Springtime Ct
- 2621 Four Seasons Dr Unit 623
- 2642 Four Seasons Dr Unit 644
- 2642-2644 Four Seasons Dr
- 2631 Four Seasons Dr Unit 629
- 4128 Springtime Ct
- 4167 Bartle Dr Unit 169
- 2613 Four Seasons Dr Unit 615
- 2637 Four Seasons Dr Unit 639
- 4159 Bartle Dr
- 4129 Springtime Ct
- 2605-2607 Four Seasons Dr
- 2605-2607 Four Seasons Dr Unit 607
- 2605 Four Seasons Dr Unit 607
- 4147 Bartle Dr