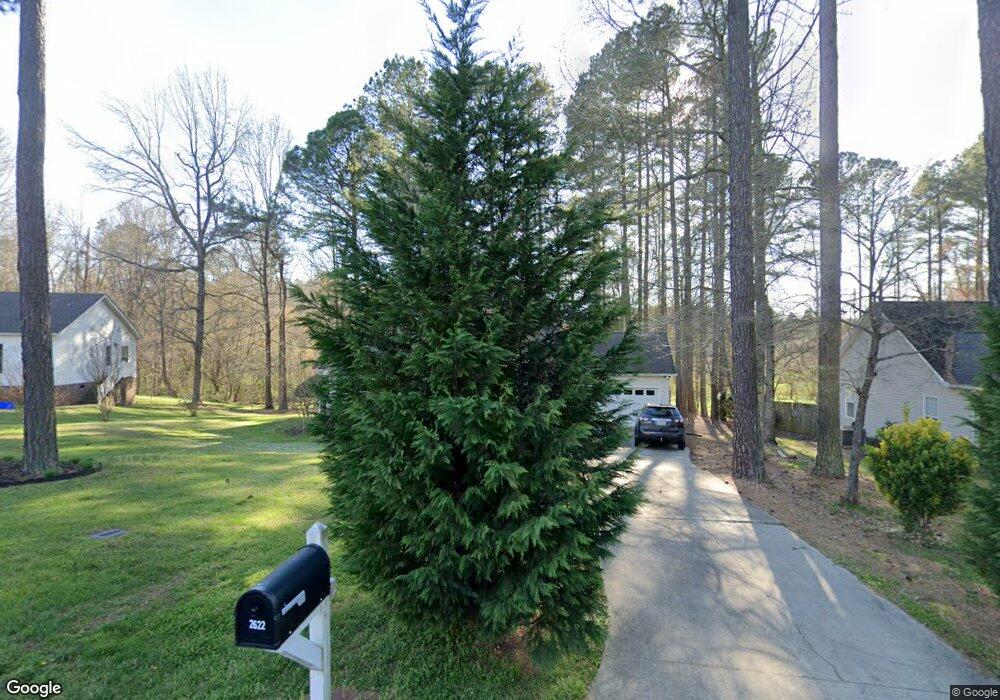
2622 Fox Fire Dr Salisbury, NC 28147
Estimated Value: $242,639 - $285,000
3
Beds
2
Baths
1,285
Sq Ft
$207/Sq Ft
Est. Value
About This Home
This home is located at 2622 Fox Fire Dr, Salisbury, NC 28147 and is currently estimated at $266,160, approximately $207 per square foot. 2622 Fox Fire Dr is a home located in Rowan County with nearby schools including Knollwood Elementary School, North Rowan Middle School, and Salisbury High School.
Ownership History
Date
Name
Owned For
Owner Type
Purchase Details
Closed on
Apr 29, 2016
Sold by
Wilmington Savings Fund Society Fsb
Bought by
Rossman Jeffrey J and Rossman Pamela J
Current Estimated Value
Purchase Details
Closed on
Apr 22, 2015
Sold by
Williams Bernice
Bought by
Wilmington Savings Fund Society Fsb
Purchase Details
Closed on
Mar 25, 2012
Sold by
Williams Donnie E
Bought by
Williams Bernice and Blue Bernice W
Purchase Details
Closed on
Jun 7, 2005
Sold by
Burris Tammy D and Pilegard Edward M
Bought by
Blue Bernice W and Williams Donnie E
Home Financials for this Owner
Home Financials are based on the most recent Mortgage that was taken out on this home.
Original Mortgage
$114,000
Interest Rate
8.55%
Mortgage Type
Fannie Mae Freddie Mac
Create a Home Valuation Report for This Property
The Home Valuation Report is an in-depth analysis detailing your home's value as well as a comparison with similar homes in the area
Home Values in the Area
Average Home Value in this Area
Purchase History
| Date | Buyer | Sale Price | Title Company |
|---|---|---|---|
| Rossman Jeffrey J | $121,000 | None Available | |
| Wilmington Savings Fund Society Fsb | $128,000 | Servicelink | |
| Williams Bernice | -- | None Available | |
| Blue Bernice W | $117,000 | -- |
Source: Public Records
Mortgage History
| Date | Status | Borrower | Loan Amount |
|---|---|---|---|
| Previous Owner | Blue Bernice W | $114,000 |
Source: Public Records
Tax History
| Year | Tax Paid | Tax Assessment Tax Assessment Total Assessment is a certain percentage of the fair market value that is determined by local assessors to be the total taxable value of land and additions on the property. | Land | Improvement |
|---|---|---|---|---|
| 2025 | $2,473 | $206,802 | $28,000 | $178,802 |
| 2024 | $2,473 | $206,802 | $28,000 | $178,802 |
| 2023 | $2,473 | $206,802 | $28,000 | $178,802 |
| 2022 | $1,870 | $135,775 | $18,500 | $117,275 |
| 2021 | $1,870 | $135,775 | $18,500 | $117,275 |
| 2020 | $1,870 | $135,775 | $18,500 | $117,275 |
| 2019 | $1,870 | $135,775 | $18,500 | $117,275 |
| 2018 | $1,595 | $117,404 | $18,500 | $98,904 |
| 2017 | $1,511 | $111,816 | $18,500 | $93,316 |
| 2016 | $1,470 | $111,816 | $18,500 | $93,316 |
| 2015 | $1,479 | $111,816 | $18,500 | $93,316 |
| 2014 | $1,434 | $109,726 | $18,500 | $91,226 |
Source: Public Records
Map
Nearby Homes
- 419 Winsley Dr
- 418 Winsley Dr
- 1212 Rowan Mills Rd
- 709 Sunset Dr
- 2260 Cranberry Way
- 704 Colby Cir
- 402 Swaim Ct
- 0 W Jake Alexander Blvd Unit CAR4042762
- 159 Grants Landing Dr
- 147 Grants Landing Dr
- 153 Grants Landing Dr
- 182 Grants Landing Dr
- 176 Grants Landing Dr
- 158 Grants Landing Dr
- 171 Grants Landing Dr
- 183 Grants Landing Dr
- 164 Grants Landing Dr
- 165 Grants Landing Dr
- 177 Grants Landing Dr
- 1950 Rosemont St
- 2626 Fox Fire Dr
- 2618 Fox Fire Dr
- 2614 Fox Fire Dr
- 2621 Fox Fire Dr
- 2611 Fox Fire Dr
- 2610 Foxfire Dr
- 2610 Fox Fire Dr
- 2603 Fox Fire Dr
- 2601 Fox Fire Dr
- 2606 Foxfire Dr
- 2606 Fox Fire Dr
- 2521 Fox Fire Dr
- 2602 Fox Fire Dr
- 2602 Fox Fire Dr Unit 10
- 2526 Fox Fire Dr
- 2517 Fox Fire Dr
- 2517 Foxfire Dr
- 2522 Fox Fire Dr
- 2518 Fox Fire Dr
- 2509 Foxfire Dr
Your Personal Tour Guide
Ask me questions while you tour the home.