2622 Franklin St Bellingham, WA 98225
Sunnyland NeighborhoodEstimated Value: $550,952 - $619,000
1
Bed
2
Baths
1,088
Sq Ft
$530/Sq Ft
Est. Value
About This Home
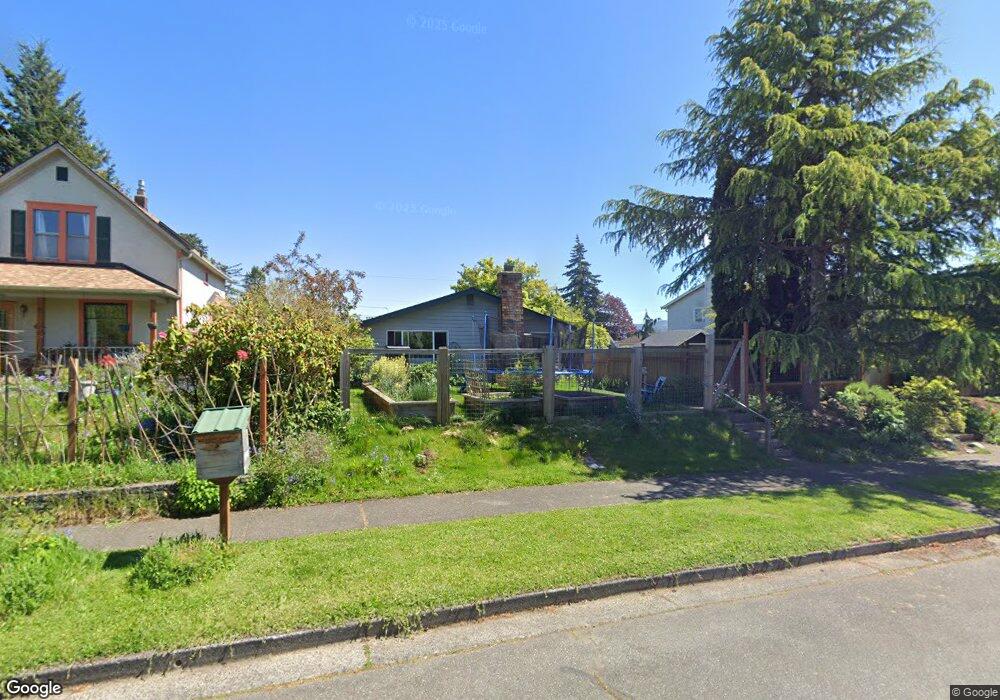
This home is located at 2622 Franklin St, Bellingham, WA 98225 and is currently estimated at $576,988, approximately $530 per square foot. 2622 Franklin St is a home located in Whatcom County with nearby schools including Sunnyland Elementary School, Whatcom Middle School, and Bellingham High School.
Ownership History
Date
Name
Owned For
Owner Type
Purchase Details
Closed on
Mar 24, 2023
Sold by
Johnson Patricia Ann Le
Bought by
Montgomery John A
Current Estimated Value
Purchase Details
Closed on
Mar 21, 2002
Sold by
Rofkar Dean A
Bought by
Johnson Patricia A
Home Financials for this Owner
Home Financials are based on the most recent Mortgage that was taken out on this home.
Original Mortgage
$112,238
Interest Rate
6.84%
Mortgage Type
FHA
Create a Home Valuation Report for This Property
The Home Valuation Report is an in-depth analysis detailing your home's value as well as a comparison with similar homes in the area
Home Values in the Area
Average Home Value in this Area
Purchase History
| Date | Buyer | Sale Price | Title Company |
|---|---|---|---|
| Montgomery John A | -- | -- | |
| Johnson Patricia A | $113,494 | Whatcom Land Title |
Source: Public Records
Mortgage History
| Date | Status | Borrower | Loan Amount |
|---|---|---|---|
| Previous Owner | Johnson Patricia A | $112,238 |
Source: Public Records
Tax History
| Year | Tax Paid | Tax Assessment Tax Assessment Total Assessment is a certain percentage of the fair market value that is determined by local assessors to be the total taxable value of land and additions on the property. | Land | Improvement |
|---|---|---|---|---|
| 2025 | $4,037 | $507,739 | $253,696 | $254,043 |
| 2024 | $3,935 | $492,945 | $246,304 | $246,641 |
| 2023 | $3,935 | $505,466 | $252,560 | $252,906 |
| 2022 | $3,212 | $435,754 | $217,728 | $218,026 |
| 2021 | $3,152 | $345,837 | $172,800 | $173,037 |
| 2020 | $3,120 | $320,219 | $160,000 | $160,219 |
| 2019 | $2,794 | $306,460 | $146,406 | $160,054 |
| 2018 | $2,813 | $275,099 | $131,446 | $143,653 |
| 2017 | $2,425 | $236,850 | $113,168 | $123,682 |
| 2016 | $2,123 | $213,368 | $101,552 | $111,816 |
| 2015 | $1,971 | $194,438 | $92,752 | $101,686 |
| 2014 | -- | $174,682 | $88,000 | $86,682 |
| 2013 | -- | $182,219 | $86,100 | $96,119 |
Source: Public Records
Map
Nearby Homes
- 2624 Franklin St
- 2618 Franklin St
- 2630 Franklin St
- 2614 Franklin St
- 2610 Franklin St
- 2632 Franklin St
- 2621 Grant St
- 2623 Grant St
- 2617 Grant St
- 2636 Franklin St
- 2629 Grant St
- 2615 Grant St
- 407 E North St
- 401 E North St
- 2633 Grant St
- 2611 Grant St
- 2621 Franklin St
- 2619 Franklin St
- 413 E North St
- 2625 Franklin St