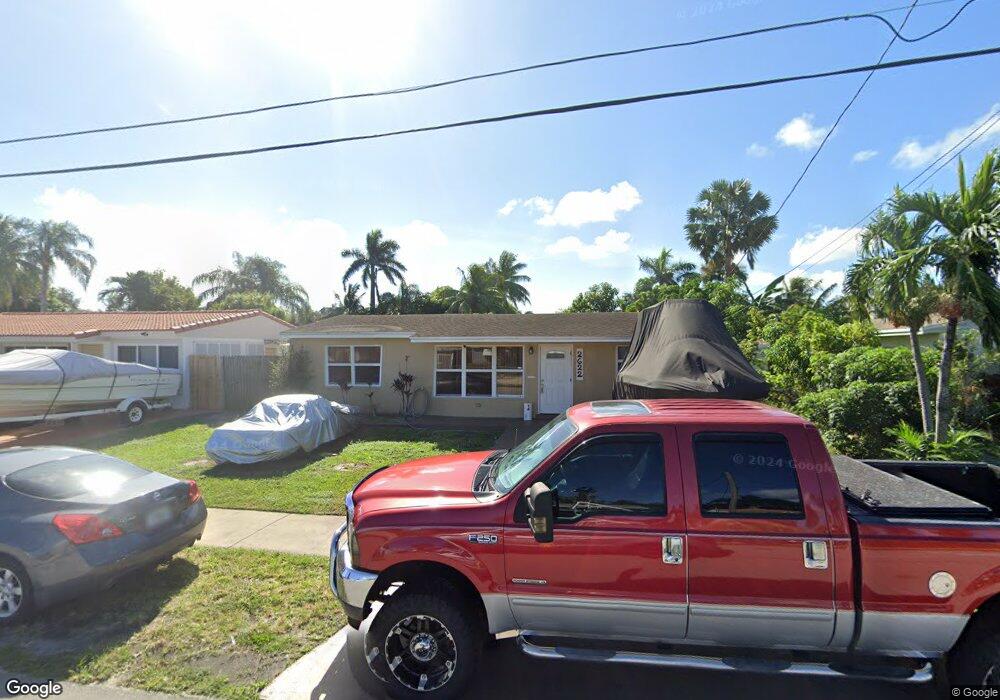
2622 Sherman St Hollywood, FL 33020
North Central Hollywood NeighborhoodEstimated Value: $393,000 - $544,000
2
Beds
1
Bath
744
Sq Ft
$622/Sq Ft
Est. Value
About This Home
This home is located at 2622 Sherman St, Hollywood, FL 33020 and is currently estimated at $462,917, approximately $622 per square foot. 2622 Sherman St is a home located in Broward County with nearby schools including Oakridge Elementary School, Attucks Middle School, and South Broward High School.
Ownership History
Date
Name
Owned For
Owner Type
Purchase Details
Closed on
Jul 21, 2008
Sold by
Us Bank Na
Bought by
Olivero Raul
Current Estimated Value
Purchase Details
Closed on
Feb 19, 2008
Sold by
Sitkovetski Arthur and Sitkovetski Valentina
Bought by
Us Bank Na
Purchase Details
Closed on
Feb 15, 2006
Sold by
Stotland Zinaida
Bought by
Sitkoverski Arthur and Sitkovetski Valentina
Home Financials for this Owner
Home Financials are based on the most recent Mortgage that was taken out on this home.
Original Mortgage
$77,000
Interest Rate
5.69%
Mortgage Type
Stand Alone Second
Purchase Details
Closed on
Nov 9, 2005
Sold by
Reverri Kay
Bought by
Stotland Zinaida
Home Financials for this Owner
Home Financials are based on the most recent Mortgage that was taken out on this home.
Original Mortgage
$280,500
Interest Rate
9.15%
Mortgage Type
Fannie Mae Freddie Mac
Purchase Details
Closed on
Nov 1, 1990
Sold by
Available Not
Bought by
Available Not
Create a Home Valuation Report for This Property
The Home Valuation Report is an in-depth analysis detailing your home's value as well as a comparison with similar homes in the area
Home Values in the Area
Average Home Value in this Area
Purchase History
| Date | Buyer | Sale Price | Title Company |
|---|---|---|---|
| Olivero Raul | $145,000 | Attorney | |
| Us Bank Na | -- | Attorney | |
| Sitkoverski Arthur | $385,000 | Supreme Title & Escrow Inc | |
| Stotland Zinaida | $330,000 | None Available | |
| Available Not | $39,286 | -- |
Source: Public Records
Mortgage History
| Date | Status | Borrower | Loan Amount |
|---|---|---|---|
| Previous Owner | Sitkoverski Arthur | $77,000 | |
| Previous Owner | Sitkoverski Arthur | $308,000 | |
| Previous Owner | Stotland Zinaida | $280,500 |
Source: Public Records
Tax History Compared to Growth
Tax History
| Year | Tax Paid | Tax Assessment Tax Assessment Total Assessment is a certain percentage of the fair market value that is determined by local assessors to be the total taxable value of land and additions on the property. | Land | Improvement |
|---|---|---|---|---|
| 2025 | $2,776 | $162,940 | -- | -- |
| 2024 | $2,674 | $158,350 | -- | -- |
| 2023 | $2,674 | $153,740 | $0 | $0 |
| 2022 | $2,520 | $149,270 | $0 | $0 |
| 2021 | $2,445 | $144,930 | $0 | $0 |
| 2020 | $2,397 | $142,930 | $0 | $0 |
| 2019 | $2,361 | $139,720 | $0 | $0 |
| 2018 | $2,251 | $137,120 | $0 | $0 |
| 2017 | $2,146 | $134,300 | $0 | $0 |
| 2016 | $2,133 | $131,540 | $0 | $0 |
| 2015 | $2,150 | $130,630 | $0 | $0 |
| 2014 | $2,151 | $129,600 | $0 | $0 |
| 2013 | -- | $127,780 | $36,930 | $90,850 |
Source: Public Records
Map
Nearby Homes
- 2626 Thomas St
- 2622 Sheridan St
- 2615 Liberty St
- 2406 N 28th Ave
- 2441-2443 Sherman St
- 2521 Raleigh St Lake Side Lot Only
- 2517 Raleigh St Lake Side Lot Only
- 2432 Sherman St
- 2623 Harding St
- 2510 Scott St
- 2631 Wilson St
- 2431 Coolidge St
- 2731 Taft St Unit 106
- 2731 Taft St Unit 102
- 2403 Scott St
- 2506 Harding St
- 2751 Taft St Unit 302
- 2751 Taft St Unit 107
- 2751 Taft St Unit 304
- 2771 Taft St Unit 302
- 2626 Sherman St
- 2618 Sherman St
- 2630 Sherman St
- 2647 Sherman St
- 2623 Sherman St
- 2634 Sherman St
- 2610 Sherman St
- 2627 Sherman St
- 2619 Sherman St
- 2623 Thomas St
- 2627 Thomas St
- 2631 Sherman St
- 2615 Sherman St
- 2631 Thomas St
- 2615 Thomas St
- 2638 Sherman St
- 2635 Sherman St
- 2611 Sherman St
- 2635 Thomas St
- 2611 Thomas St