Estimated Value: $348,000 - $417,000
4
Beds
5
Baths
2,514
Sq Ft
$151/Sq Ft
Est. Value
About This Home
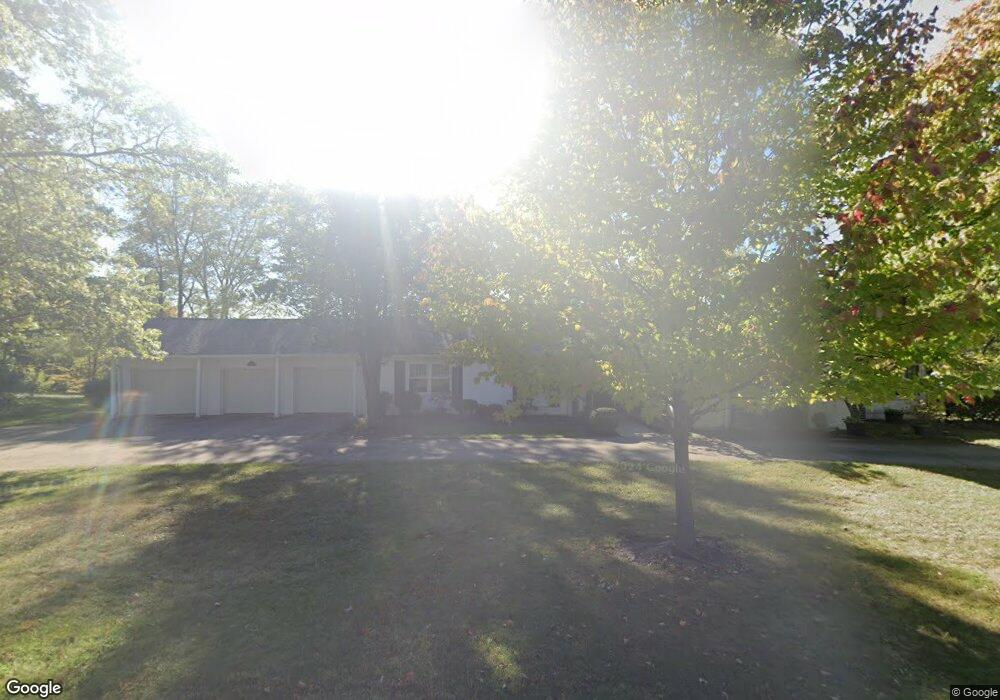
This home is located at 2622 Shoreline Dr, Lima, OH 45805 and is currently estimated at $380,481, approximately $151 per square foot. 2622 Shoreline Dr is a home located in Allen County with nearby schools including Maplewood Elementary School, Elmwood Elementary School, and Shawnee Middle School.
Ownership History
Date
Name
Owned For
Owner Type
Purchase Details
Closed on
Mar 11, 2011
Sold by
Dray David A and Dray Lynette L
Bought by
Webb Milton L and Webb Mary Anne
Current Estimated Value
Home Financials for this Owner
Home Financials are based on the most recent Mortgage that was taken out on this home.
Original Mortgage
$205,500
Outstanding Balance
$141,597
Interest Rate
4.85%
Mortgage Type
Purchase Money Mortgage
Estimated Equity
$238,884
Purchase Details
Closed on
Jun 14, 1995
Sold by
Trst Linda Long
Bought by
Dray David and Dray Lynette
Home Financials for this Owner
Home Financials are based on the most recent Mortgage that was taken out on this home.
Original Mortgage
$210,000
Interest Rate
8.27%
Mortgage Type
New Conventional
Purchase Details
Closed on
Oct 19, 1993
Sold by
Landeck Louis W
Bought by
Long Linda L Trustee
Purchase Details
Closed on
Jan 1, 1990
Bought by
Landeck Louis W
Create a Home Valuation Report for This Property
The Home Valuation Report is an in-depth analysis detailing your home's value as well as a comparison with similar homes in the area
Home Values in the Area
Average Home Value in this Area
Purchase History
| Date | Buyer | Sale Price | Title Company |
|---|---|---|---|
| Webb Milton L | $285,500 | Attorney | |
| Dray David | $282,000 | -- | |
| Long Linda L Trustee | -- | -- | |
| Landeck Louis W | -- | -- |
Source: Public Records
Mortgage History
| Date | Status | Borrower | Loan Amount |
|---|---|---|---|
| Open | Webb Milton L | $205,500 | |
| Previous Owner | Dray David | $210,000 |
Source: Public Records
Tax History Compared to Growth
Tax History
| Year | Tax Paid | Tax Assessment Tax Assessment Total Assessment is a certain percentage of the fair market value that is determined by local assessors to be the total taxable value of land and additions on the property. | Land | Improvement |
|---|---|---|---|---|
| 2024 | $5,336 | $109,490 | $31,680 | $77,810 |
| 2023 | $5,400 | $97,760 | $28,280 | $69,480 |
| 2022 | $5,441 | $97,760 | $28,280 | $69,480 |
| 2021 | $5,466 | $97,760 | $28,280 | $69,480 |
| 2020 | $4,356 | $90,270 | $34,020 | $56,250 |
| 2019 | $4,356 | $90,270 | $34,020 | $56,250 |
| 2018 | $4,339 | $90,270 | $34,020 | $56,250 |
| 2017 | $4,340 | $87,470 | $34,020 | $53,450 |
| 2016 | $4,301 | $87,470 | $34,020 | $53,450 |
| 2015 | $4,134 | $87,470 | $34,020 | $53,450 |
| 2014 | $4,134 | $83,020 | $31,360 | $51,660 |
| 2013 | $4,055 | $83,020 | $31,360 | $51,660 |
Source: Public Records
Map
Nearby Homes
- 2297 June Dr
- 1408 Winghaven Dr
- 250 Squire Ln
- 2992 Autumn Leaves Ct
- 1635 Tanglewood Ln
- 2635 Adgate Rd Unit 112
- 1453 W Shore Dr
- 2997 Cletus Pkwy
- 2225 Arcadia Ave
- 1424 Loch Loman Way
- 3390 Spencerville Rd
- 1446 Adak Ave
- 5 Estate Dr
- 2 Estate Dr
- 6 Estate Dr
- 1 Estate Dr
- 2921 Canterbury Dr
- 1440 Riverview Dr
- 7 Estate Dr
- 2418 Adgate Rd