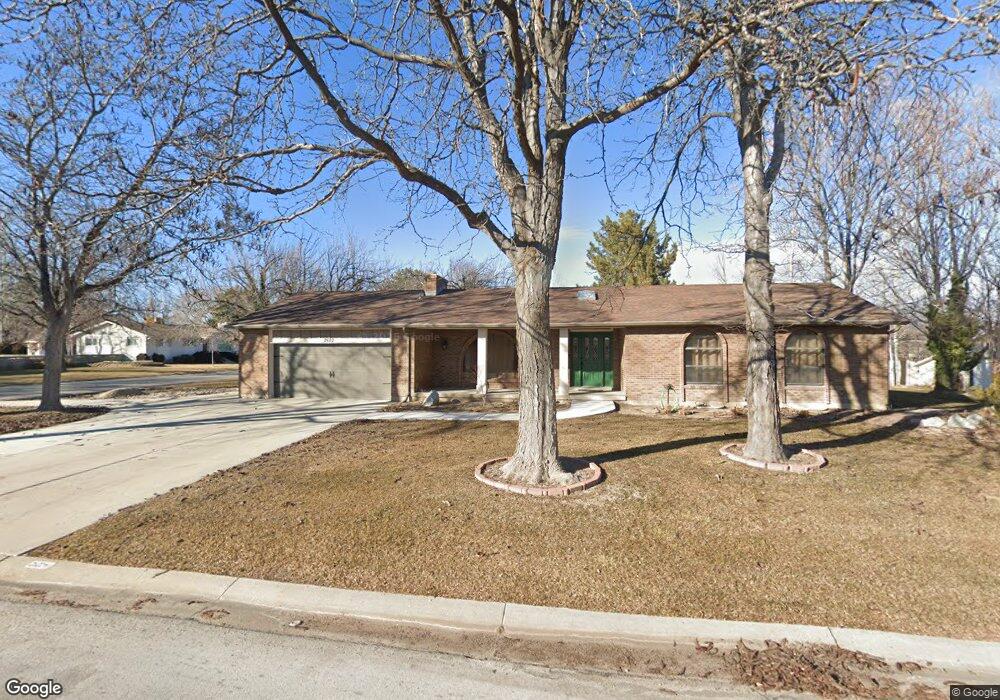
2622 W Carson Ln West Jordan, UT 84084
Estimated Value: $611,000 - $695,000
5
Beds
3
Baths
3,293
Sq Ft
$198/Sq Ft
Est. Value
About This Home
This home is located at 2622 W Carson Ln, West Jordan, UT 84084 and is currently estimated at $652,583, approximately $198 per square foot. 2622 W Carson Ln is a home located in Salt Lake County with nearby schools including West Jordan School, Majestic Elementary Arts Academy, and West Jordan Middle School.
Ownership History
Date
Name
Owned For
Owner Type
Purchase Details
Closed on
Aug 11, 2020
Sold by
Potter Milton E
Bought by
Potter Milton
Current Estimated Value
Home Financials for this Owner
Home Financials are based on the most recent Mortgage that was taken out on this home.
Original Mortgage
$230,500
Outstanding Balance
$204,470
Interest Rate
3%
Mortgage Type
New Conventional
Estimated Equity
$448,113
Purchase Details
Closed on
Mar 10, 2014
Sold by
Potter Kristen A
Bought by
Potter Milton E
Purchase Details
Closed on
Nov 21, 2013
Sold by
Schmidt Blaine and Schmidt Cherie
Bought by
Potter Milton E and Potter Kristen A
Home Financials for this Owner
Home Financials are based on the most recent Mortgage that was taken out on this home.
Original Mortgage
$256,500
Interest Rate
4.18%
Mortgage Type
New Conventional
Create a Home Valuation Report for This Property
The Home Valuation Report is an in-depth analysis detailing your home's value as well as a comparison with similar homes in the area
Home Values in the Area
Average Home Value in this Area
Purchase History
| Date | Buyer | Sale Price | Title Company |
|---|---|---|---|
| Potter Milton | -- | North American Title Llc | |
| Potter Milton E | -- | None Available | |
| Potter Milton E | -- | Metro National Title |
Source: Public Records
Mortgage History
| Date | Status | Borrower | Loan Amount |
|---|---|---|---|
| Open | Potter Milton | $230,500 | |
| Closed | Potter Milton E | $256,500 |
Source: Public Records
Tax History Compared to Growth
Tax History
| Year | Tax Paid | Tax Assessment Tax Assessment Total Assessment is a certain percentage of the fair market value that is determined by local assessors to be the total taxable value of land and additions on the property. | Land | Improvement |
|---|---|---|---|---|
| 2025 | $3,067 | $611,300 | $156,600 | $454,700 |
| 2024 | $3,067 | $590,100 | $151,400 | $438,700 |
| 2023 | $3,067 | $537,900 | $145,600 | $392,300 |
| 2022 | $3,081 | $549,700 | $142,700 | $407,000 |
| 2021 | $2,604 | $422,800 | $112,900 | $309,900 |
| 2020 | $2,426 | $369,800 | $105,500 | $264,300 |
| 2019 | $2,456 | $367,100 | $105,500 | $261,600 |
| 2018 | $2,240 | $332,100 | $99,700 | $232,400 |
| 2017 | $2,094 | $309,000 | $99,700 | $209,300 |
| 2016 | $2,009 | $278,600 | $99,700 | $178,900 |
| 2015 | $1,976 | $267,100 | $101,600 | $165,500 |
| 2014 | $1,890 | $251,500 | $96,800 | $154,700 |
Source: Public Records
Map
Nearby Homes
- 2683 W Carson Ln
- 6918 S Harvest Cir
- 2421 W 6900 S
- 2333 W Ledgewood Dr
- 6512 Timpanogos Way
- 6924 S 2160 W
- 8524 S Michele River Ave W Unit 109
- 2332 Broderick Dr
- 2312 W Hidden Bend Cove Unit 107
- 6893 S 3200 W
- 6453 Fremont Peak Cir
- 6925 S Lexington Dr
- 3052 W Matterhorn Dr
- 6683 Alice Susanna Ln
- 2126 W Happiness Dr
- 2342 W 6200 S
- 3226 Tysonbrook Ct
- 7361 S 2700 W
- 6672 S 3335 W
- 1951 W 7125 S