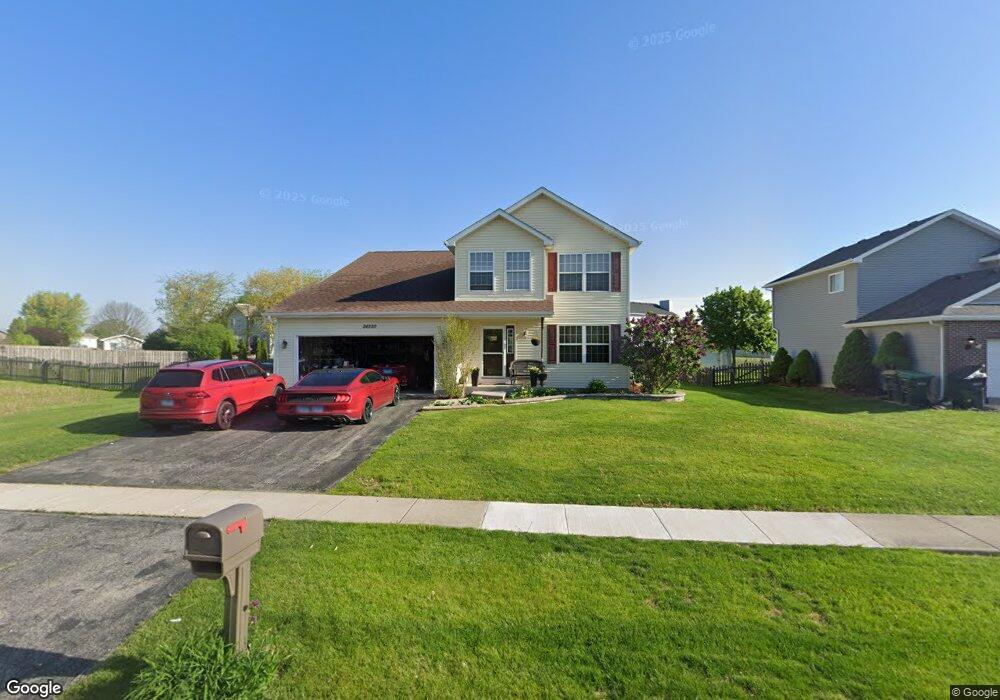
26220 S Evergreen Ln Unit 12 Channahon, IL 60410
South DuPage River NeighborhoodEstimated Value: $388,020 - $433,000
4
Beds
3
Baths
2,300
Sq Ft
$179/Sq Ft
Est. Value
About This Home
This home is located at 26220 S Evergreen Ln Unit 12, Channahon, IL 60410 and is currently estimated at $411,255, approximately $178 per square foot. 26220 S Evergreen Ln Unit 12 is a home located in Will County with nearby schools including N B Galloway Elementary School, Pioneer Path School, and Three Rivers School.
Ownership History
Date
Name
Owned For
Owner Type
Purchase Details
Closed on
Jan 10, 2005
Sold by
Bernicky Jason M and Bernicky Terese
Bought by
Carrera Edwiges and Montenegro Lucia
Current Estimated Value
Home Financials for this Owner
Home Financials are based on the most recent Mortgage that was taken out on this home.
Original Mortgage
$176,800
Outstanding Balance
$94,230
Interest Rate
6.6%
Mortgage Type
Purchase Money Mortgage
Estimated Equity
$320,902
Purchase Details
Closed on
Feb 20, 2004
Sold by
Citizens First National Bank Princeton
Bought by
Bernicky Jason M and Bernicky Terese
Home Financials for this Owner
Home Financials are based on the most recent Mortgage that was taken out on this home.
Original Mortgage
$190,464
Interest Rate
5.77%
Mortgage Type
FHA
Create a Home Valuation Report for This Property
The Home Valuation Report is an in-depth analysis detailing your home's value as well as a comparison with similar homes in the area
Home Values in the Area
Average Home Value in this Area
Purchase History
| Date | Buyer | Sale Price | Title Company |
|---|---|---|---|
| Carrera Edwiges | $221,000 | First American Title | |
| Bernicky Jason M | $187,500 | First American |
Source: Public Records
Mortgage History
| Date | Status | Borrower | Loan Amount |
|---|---|---|---|
| Open | Carrera Edwiges | $176,800 | |
| Previous Owner | Bernicky Jason M | $190,464 | |
| Closed | Carrera Edwiges | $44,200 |
Source: Public Records
Tax History Compared to Growth
Tax History
| Year | Tax Paid | Tax Assessment Tax Assessment Total Assessment is a certain percentage of the fair market value that is determined by local assessors to be the total taxable value of land and additions on the property. | Land | Improvement |
|---|---|---|---|---|
| 2024 | $8,980 | $114,480 | $20,650 | $93,830 |
| 2023 | $8,980 | $101,086 | $18,234 | $82,852 |
| 2022 | $7,200 | $89,705 | $17,103 | $72,602 |
| 2021 | $6,733 | $84,787 | $16,165 | $68,622 |
| 2020 | $6,527 | $82,962 | $15,817 | $67,145 |
| 2019 | $6,213 | $79,200 | $15,100 | $64,100 |
| 2018 | $6,209 | $78,799 | $14,185 | $64,614 |
| 2017 | $5,901 | $73,730 | $13,598 | $60,132 |
| 2016 | $5,716 | $70,758 | $13,050 | $57,708 |
| 2015 | $4,797 | $65,650 | $12,050 | $53,600 |
| 2014 | $4,797 | $62,950 | $11,700 | $51,250 |
| 2013 | $4,797 | $61,450 | $11,700 | $49,750 |
Source: Public Records
Map
Nearby Homes
- 26124 S Bell Rd
- 26201 W Winding Oak Ct Unit 11
- Lot 8-4 Orchid Ln Unit 4
- Lot 8-1 W Orchid Ln Unit 1
- Lot 8-3 Orchid Ln Unit 3
- Lot 8-2 Orchid Ln Unit 2
- Lot 160 S Settlers Dr
- Lot 156 S Settlers Dr
- 26562 Old Kerry Grove
- 26560 Old Kerry Grove
- 26526 Justin Dr
- The Charleston Plan at Whispering Oaks - Villas
- The Lexington Plan at Whispering Oaks - Villas
- The Craftsman Plan at Whispering Oaks
- The Williamson Plan at Whispering Oaks
- The Superior Plan at Whispering Oaks
- The Braxton Plan at Whispering Oaks
- The Bettendorf Plan at Whispering Oaks
- The Westwood Plan at Whispering Oaks
- The Haven Plan at Whispering Oaks
- 26216 S Evergreen Ln Unit 12
- 26224 S Evergreen Ln Unit 12
- 26211 W Bayberry Ct
- 26212 S Evergreen Ln Unit 12
- 26210 W Bayberry Ct Unit 12
- 26165 S Bayberry Dr
- 26221 W Bayberry Ct Unit 12
- 26217 S Evergreen Ln
- 26229 S Evergreen Ln Unit 12
- 26208 S Evergreen Ln Unit 12
- 26213 S Evergreen Ln Unit 12
- 26220 W Bayberry Ct
- 26209 S Evergreen Ln
- 26200 S Evergreen Ln
- 26232 S Evergreen Ln
- 26231 W Bayberry Ct
- 26153 S Bayberry Dr
- 26148 S Bell Rd Unit 11
- 26205 S Evergreen Ln
- 26140 S Bell Rd