Estimated Value: $331,549 - $379,000
3
Beds
2
Baths
2,297
Sq Ft
$155/Sq Ft
Est. Value
About This Home
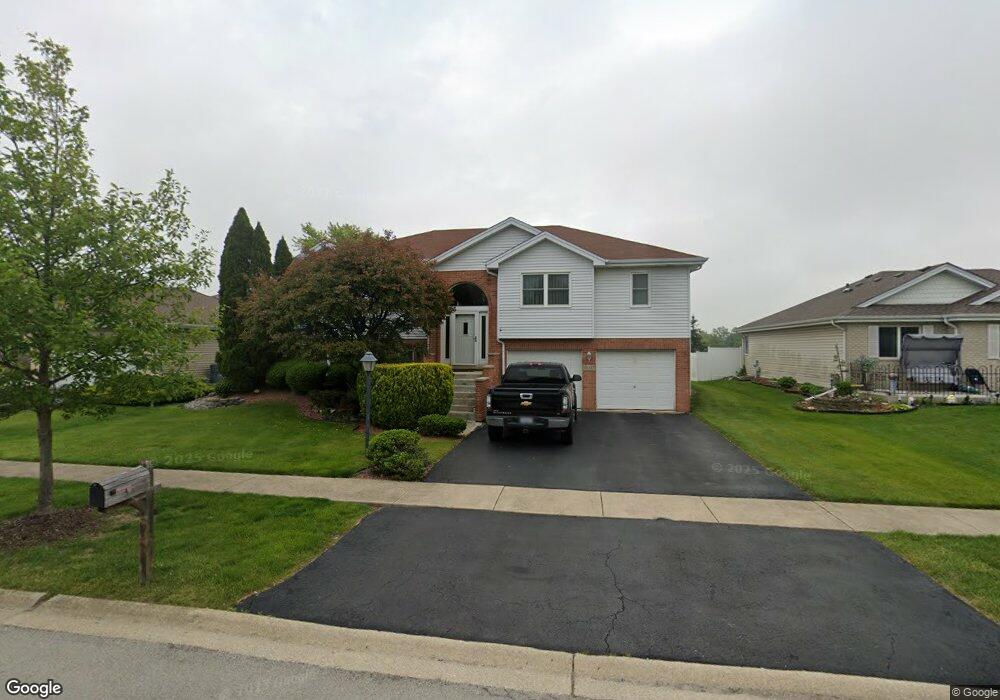
This home is located at 26227 S Ruby St, Monee, IL 60449 and is currently estimated at $356,387, approximately $155 per square foot. 26227 S Ruby St is a home with nearby schools including Monee Elementary School, Crete-Monee Middle School, and Crete-Monee High School.
Ownership History
Date
Name
Owned For
Owner Type
Purchase Details
Closed on
Sep 30, 2021
Sold by
Mcdonald Wilma J
Bought by
Mcdonald Wilma J and Wilma J Mcdonald Trust Number
Current Estimated Value
Purchase Details
Closed on
Jul 1, 2003
Sold by
Collins James F and Collins Cheryl A
Bought by
Mcdonald Wilma J
Home Financials for this Owner
Home Financials are based on the most recent Mortgage that was taken out on this home.
Original Mortgage
$120,000
Outstanding Balance
$51,402
Interest Rate
5.36%
Mortgage Type
Purchase Money Mortgage
Estimated Equity
$304,985
Purchase Details
Closed on
Aug 15, 1996
Sold by
Guglielmo Joseph A
Bought by
Collins James F and Collins Cheryl A
Home Financials for this Owner
Home Financials are based on the most recent Mortgage that was taken out on this home.
Original Mortgage
$137,000
Interest Rate
7.75%
Purchase Details
Closed on
Dec 20, 1995
Sold by
Nlsb
Bought by
Guglielmo Joseph A
Home Financials for this Owner
Home Financials are based on the most recent Mortgage that was taken out on this home.
Original Mortgage
$57,500
Interest Rate
7.43%
Create a Home Valuation Report for This Property
The Home Valuation Report is an in-depth analysis detailing your home's value as well as a comparison with similar homes in the area
Home Values in the Area
Average Home Value in this Area
Purchase History
| Date | Buyer | Sale Price | Title Company |
|---|---|---|---|
| Mcdonald Wilma J | -- | None Available | |
| Mcdonald Wilma J | $209,000 | Chicago Title Insurance Co | |
| Collins James F | $157,000 | -- | |
| Guglielmo Joseph A | $143,000 | -- |
Source: Public Records
Mortgage History
| Date | Status | Borrower | Loan Amount |
|---|---|---|---|
| Open | Mcdonald Wilma J | $120,000 | |
| Previous Owner | Collins James F | $137,000 | |
| Previous Owner | Guglielmo Joseph A | $57,500 |
Source: Public Records
Tax History
| Year | Tax Paid | Tax Assessment Tax Assessment Total Assessment is a certain percentage of the fair market value that is determined by local assessors to be the total taxable value of land and additions on the property. | Land | Improvement |
|---|---|---|---|---|
| 2024 | $9,050 | $102,783 | $16,561 | $86,222 |
| 2023 | $9,050 | $88,606 | $14,277 | $74,329 |
| 2022 | $7,906 | $77,943 | $12,559 | $65,384 |
| 2021 | $7,447 | $70,991 | $11,535 | $59,456 |
| 2020 | $7,395 | $68,690 | $11,161 | $57,529 |
| 2019 | $7,138 | $65,140 | $10,584 | $54,556 |
| 2018 | $6,980 | $63,163 | $10,357 | $52,806 |
| 2017 | $6,890 | $61,294 | $10,069 | $51,225 |
| 2016 | $6,575 | $58,111 | $9,722 | $48,389 |
| 2015 | $5,722 | $53,600 | $8,958 | $44,642 |
| 2014 | $5,722 | $52,860 | $8,834 | $44,026 |
| 2013 | $5,722 | $55,350 | $9,250 | $46,100 |
Source: Public Records
Map
Nearby Homes
- 5103 W Park Ln
- 4942 W Ribbon Ct
- 5221 W Mulberry Ln
- 5110 Fairground Ct
- 5125 W Margaret St
- 5320 W Orchard Trail
- 26048 S Countyfair Dr
- 5332 W Mulberry Ln
- 5418 W Margaret St
- 25807 S Doral Dr
- 4816 W Roberts Ridge Rd
- 25836 S Linden Ave
- 25751 Scioto Dr Unit 34
- 25727 S Mccorkle Ave
- 26760 S Fox Wood Dr
- 25753 Shoal Creek Dr Unit 208
- Lot 4 S Governors Hwy
- 5016 W Colonial Dr Unit 317
- 4825 Colonial Dr Unit 219
- 26616 S Egyptian Trail
- 26221 S Ruby St Unit 1
- 26237 S Ruby St
- 26245 S Ruby St Unit 1
- 5101 Countyfair Ct Unit 1
- 26234 S Ruby St
- 26213 S Ruby St Unit 1
- 26242 S Ruby St Unit 1
- 5107 Countyfair Ct
- 26212 Eagle Dr
- 26205 S Ruby St
- 5102 Countyfair Ct
- 26258 S Ruby St Unit 1
- 5113 Countyfair Ct
- 26204 Eagle Dr
- 5108 Countyfair Ct
- 26157 S Ruby St Unit 1
- 5114 Countyfair Ct Unit 3
- 26156 S Eagle Dr
- 26149 S Ruby St
- 5109 W Park Ln
Your Personal Tour Guide
Ask me questions while you tour the home.