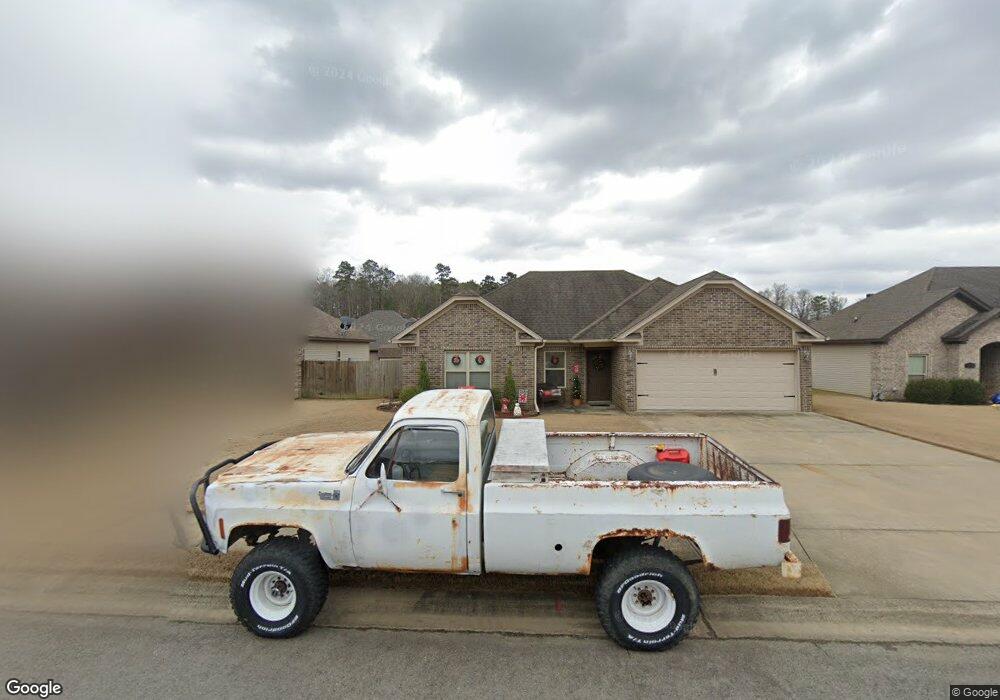
2623 Finley Loop Bryant, AR 72022
Estimated Value: $239,000 - $246,000
Studio
2
Baths
1,607
Sq Ft
$151/Sq Ft
Est. Value
About This Home
This home is located at 2623 Finley Loop, Bryant, AR 72022 and is currently estimated at $241,939, approximately $150 per square foot. 2623 Finley Loop is a home located in Saline County with nearby schools including Springhill Elementary School and Arkansas Christian Academy.
Ownership History
Date
Name
Owned For
Owner Type
Purchase Details
Closed on
Jul 22, 2016
Sold by
Johnson Brandon
Bought by
Hodge Julia A
Current Estimated Value
Home Financials for this Owner
Home Financials are based on the most recent Mortgage that was taken out on this home.
Original Mortgage
$156,812
Outstanding Balance
$125,022
Interest Rate
3.54%
Mortgage Type
New Conventional
Estimated Equity
$116,917
Purchase Details
Closed on
May 29, 2015
Sold by
Johnson Jannas A and Johnson Ashlee
Bought by
Johnson Brandon
Home Financials for this Owner
Home Financials are based on the most recent Mortgage that was taken out on this home.
Original Mortgage
$138,013
Interest Rate
3.82%
Mortgage Type
FHA
Purchase Details
Closed on
Jun 3, 2011
Bought by
Johnson
Purchase Details
Closed on
May 27, 2011
Bought by
Johnson
Create a Home Valuation Report for This Property
The Home Valuation Report is an in-depth analysis detailing your home's value as well as a comparison with similar homes in the area
Home Values in the Area
Average Home Value in this Area
Purchase History
| Date | Buyer | Sale Price | Title Company |
|---|---|---|---|
| Hodge Julia A | $152,500 | Saline County Abstract & Guara | |
| Johnson Brandon | -- | None Available | |
| Johnson | $144,500 | -- | |
| Johnson | $144,500 | -- |
Source: Public Records
Mortgage History
| Date | Status | Borrower | Loan Amount |
|---|---|---|---|
| Open | Hodge Julia A | $156,812 | |
| Previous Owner | Johnson Brandon | $138,013 |
Source: Public Records
Tax History
| Year | Tax Paid | Tax Assessment Tax Assessment Total Assessment is a certain percentage of the fair market value that is determined by local assessors to be the total taxable value of land and additions on the property. | Land | Improvement |
|---|---|---|---|---|
| 2025 | $1,991 | $39,311 | $7,280 | $32,031 |
| 2024 | $1,816 | $39,311 | $7,280 | $32,031 |
| 2023 | $2,017 | $39,311 | $7,280 | $32,031 |
| 2022 | $1,936 | $39,311 | $7,280 | $32,031 |
| 2021 | $1,858 | $32,350 | $5,600 | $26,750 |
| 2020 | $1,858 | $32,350 | $5,600 | $26,750 |
| 2019 | $1,858 | $32,350 | $5,600 | $26,750 |
| 2018 | $1,883 | $32,350 | $5,600 | $26,750 |
| 2017 | $1,883 | $32,350 | $5,600 | $26,750 |
| 2016 | $1,496 | $30,660 | $5,000 | $25,660 |
| 2015 | $1,496 | $30,660 | $5,000 | $25,660 |
| 2014 | -- | $30,660 | $5,000 | $25,660 |
Source: Public Records
Map
Nearby Homes
- 2705 Finley Loop
- 4600 Hilldale Rd
- 2502 Daisy Cove
- 1219 War Eagle Dr
- 6302 Rim Fire Cove
- 4060 Marshall Way
- 4054 Marshall Way
- 4036 Marshall Way
- 2405 Sam Tillery Dr
- 2413 Sam Tillery Dr
- 5709 Tumble Rock Ct
- 9040 Naples Cove
- 233 Cason Hill Blvd
- 246 Cason Hill Blvd
- 234 Cason Hill Blvd
- 5184 Peace Ln
- 6899 Grace Village Dr
- 9017 Naples Cove
- 6898 Grace Village Dr
- 5168 Peace Ln
- 2625 Finley Loop
- 2621 Finley Loop
- 0 Finley Lp Unit 16006506
- 3003 Chapman Ct
- 2802 Roset Ln
- 3005 Chapman Ct
- 2804 Roset Ln
- 2622 Finley Loop
- 2624 Finley Loop
- 2620 Finley Loop
- 2617 Finley Loop
- 2703 Finley Loop
- 2700 Finley Loop
- 2618 Finley Loop
- 3007 Chapman Ct
- 3002 Chapman Ct
- 2803 Roset Ln
- 2806 Roset Ln
- 3004 Chapman Ct
- 2805 Roset Ln
Your Personal Tour Guide
Ask me questions while you tour the home.