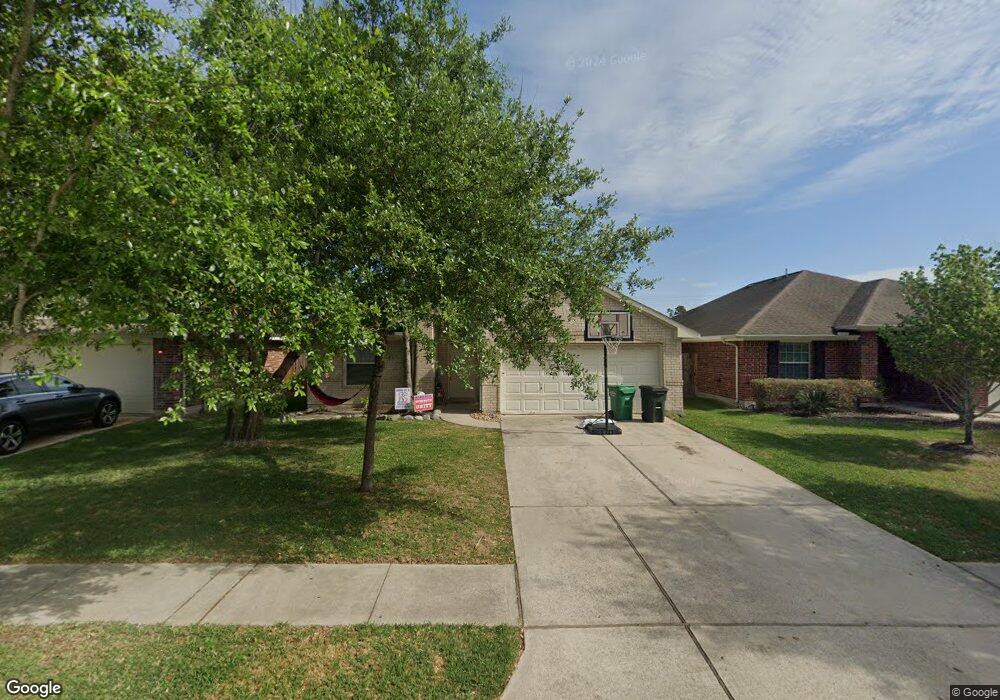
2623 Fowler Park Conroe, TX 77385
Imperial Oaks NeighborhoodEstimated Value: $279,000 - $309,000
3
Beds
2
Baths
1,956
Sq Ft
$150/Sq Ft
Est. Value
About This Home
This home is located at 2623 Fowler Park, Conroe, TX 77385 and is currently estimated at $293,960, approximately $150 per square foot. 2623 Fowler Park is a home located in Montgomery County with nearby schools including Kaufman Elementary School, Vogel Intermediate School, and Irons J High School.
Ownership History
Date
Name
Owned For
Owner Type
Purchase Details
Closed on
Apr 28, 2024
Sold by
Struthers Jesse
Bought by
Struthers Barry and Struthers Ruth
Current Estimated Value
Purchase Details
Closed on
Jun 23, 2010
Sold by
Fuller Charles Scott
Bought by
Struthers Jesse and Struthers Barry
Home Financials for this Owner
Home Financials are based on the most recent Mortgage that was taken out on this home.
Original Mortgage
$140,013
Interest Rate
4.87%
Mortgage Type
FHA
Purchase Details
Closed on
Oct 4, 2005
Sold by
Fuller Andrea Lee
Bought by
Fuller Charles Scott
Purchase Details
Closed on
Dec 10, 2004
Sold by
J & S Imperial Oaks Ii Ltd
Bought by
Fuller Charles S and Fuller Andrea L
Home Financials for this Owner
Home Financials are based on the most recent Mortgage that was taken out on this home.
Original Mortgage
$139,299
Interest Rate
5.64%
Mortgage Type
VA
Purchase Details
Closed on
Sep 17, 2003
Sold by
Imperial Oaks No 3 Ltd
Bought by
Struthers Barry and Struthers Ruth
Create a Home Valuation Report for This Property
The Home Valuation Report is an in-depth analysis detailing your home's value as well as a comparison with similar homes in the area
Home Values in the Area
Average Home Value in this Area
Purchase History
| Date | Buyer | Sale Price | Title Company |
|---|---|---|---|
| Struthers Barry | -- | None Listed On Document | |
| Struthers Jesse | -- | Old Republic Title | |
| Fuller Charles Scott | -- | -- | |
| Fuller Charles S | -- | Stewart Title Of Montgomery | |
| Struthers Barry | -- | -- |
Source: Public Records
Mortgage History
| Date | Status | Borrower | Loan Amount |
|---|---|---|---|
| Previous Owner | Struthers Jesse | $140,013 | |
| Previous Owner | Fuller Charles S | $139,299 |
Source: Public Records
Tax History Compared to Growth
Tax History
| Year | Tax Paid | Tax Assessment Tax Assessment Total Assessment is a certain percentage of the fair market value that is determined by local assessors to be the total taxable value of land and additions on the property. | Land | Improvement |
|---|---|---|---|---|
| 2025 | $5,677 | $303,510 | $50,000 | $253,510 |
| 2024 | $7,008 | $310,609 | $50,000 | $260,609 |
| 2023 | $7,008 | $301,470 | $50,000 | $251,470 |
| 2022 | $6,972 | $272,880 | $23,500 | $249,380 |
| 2021 | $5,804 | $210,090 | $23,500 | $186,590 |
| 2020 | $5,807 | $201,330 | $23,500 | $177,830 |
| 2019 | $6,059 | $204,390 | $23,500 | $180,890 |
| 2018 | $5,442 | $183,570 | $23,500 | $160,070 |
| 2017 | $5,473 | $183,570 | $23,500 | $160,070 |
| 2016 | $5,416 | $181,660 | $23,500 | $158,160 |
| 2015 | $4,773 | $181,660 | $23,500 | $158,160 |
| 2014 | $4,773 | $156,400 | $23,500 | $132,900 |
Source: Public Records
Map
Nearby Homes
- 32315 Golden Oak Park Ln
- 2614 Winding Creek Way
- 2611 Winding Creek Way
- 32331 Summer Park Ln
- 31815 Forest Oak Ln
- 31602 Forest Oak Park Ct
- 31810 Forest Oak Ln
- 2707 Oak Pass Ct
- 32319 Archer Park
- 2715 Kingsbury Park Ln
- 31903 Burnt Wood Ct
- 2643 Imperial Grove Ln
- 2611 Cedar Path Ln
- 2526 Hidden Park Ln
- 2610 Cedar Path Ln
- 2623 Cedar Path Ln
- 31419 Fountainbrook Park Ln
- 2898 Woodland Glen Ln
- 2606 Ivy Wood Ln
- 2645 Ivy Wood Ln
- 2627 Fowler Park
- 2619 Fowler Park
- 2615 Fowler Park
- 2631 Fowler Park
- 2611 Fowler Park
- 32310 Cross Spring Park Ln
- 32303 Golden Oak Park Ln
- 2635 Fowler Park
- 2607 Fowler Park
- 32314 Cross Spring Park Ln
- 32307 Golden Oak Park Ln
- 32314 Cross Spring
- 32303 Cross Spring Park Ln
- 2603 Fowler Park
- 2630 Winding Creek Way
- 2626 Winding Creek Way
- 32318 Cross Spring Park Ln
- 32311 Golden Oak Park Ln
- 2634 Winding Creek Way
- 2622 Winding Creek Way