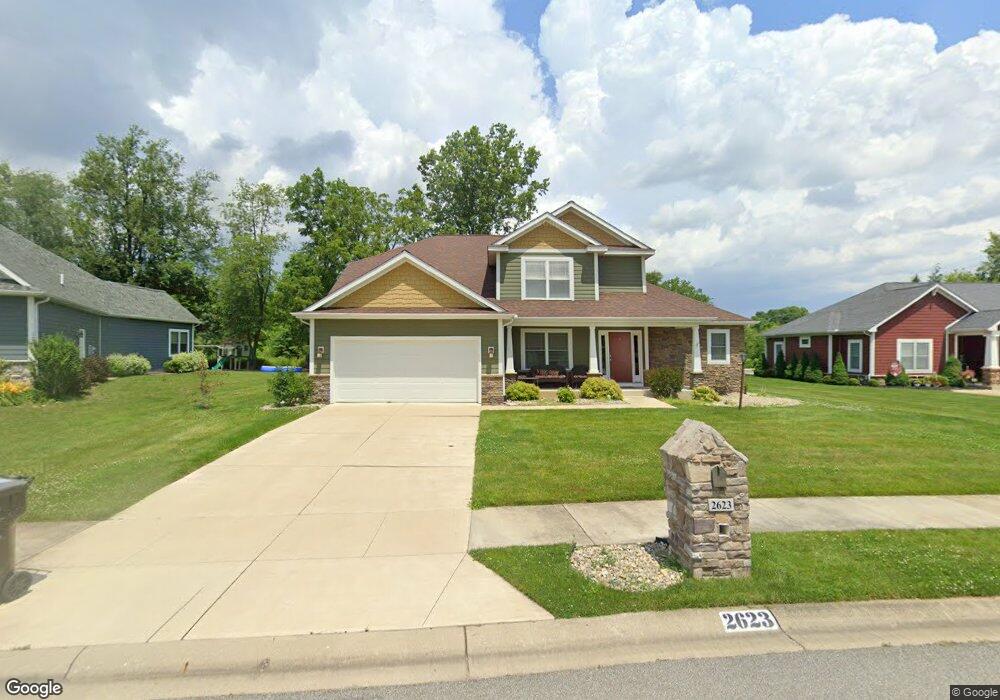
2623 Running Deer Dr South Bend, IN 46614
Estimated Value: $421,989 - $592,000
3
Beds
3
Baths
1,380
Sq Ft
$348/Sq Ft
Est. Value
About This Home
This home is located at 2623 Running Deer Dr, South Bend, IN 46614 and is currently estimated at $480,247, approximately $348 per square foot. 2623 Running Deer Dr is a home located in St. Joseph County with nearby schools including Meadow's Edge Elementary School, Virgil I. Grissom Middle School, and Penn High School.
Ownership History
Date
Name
Owned For
Owner Type
Purchase Details
Closed on
Dec 31, 2015
Sold by
Kline Custom Homes Inc
Bought by
Hackett Davin M and Hackett Melanie S
Current Estimated Value
Home Financials for this Owner
Home Financials are based on the most recent Mortgage that was taken out on this home.
Original Mortgage
$305,428
Outstanding Balance
$241,612
Interest Rate
3.96%
Mortgage Type
New Conventional
Estimated Equity
$238,635
Purchase Details
Closed on
Sep 24, 2015
Sold by
Relative Investments Llc
Bought by
Kline Custom Homes Inc
Purchase Details
Closed on
Nov 10, 2011
Sold by
Fifth Third Bank
Bought by
Relative Investments Llc
Purchase Details
Closed on
Oct 13, 2011
Sold by
Always Development Corp
Bought by
Fifth Third Bank
Create a Home Valuation Report for This Property
The Home Valuation Report is an in-depth analysis detailing your home's value as well as a comparison with similar homes in the area
Home Values in the Area
Average Home Value in this Area
Purchase History
| Date | Buyer | Sale Price | Title Company |
|---|---|---|---|
| Hackett Davin M | -- | Meridian Title | |
| Hackett Davin M | -- | Meridian Title | |
| Kline Custom Homes Inc | -- | Meridian Title | |
| Kline Custom Homes Inc | -- | Meridian Title | |
| Relative Investments Llc | -- | None Available | |
| Relative Investments Llc | -- | None Available | |
| Fifth Third Bank | $220,500 | None Available | |
| Fifth Third Bank | $220,500 | None Available |
Source: Public Records
Mortgage History
| Date | Status | Borrower | Loan Amount |
|---|---|---|---|
| Open | Hackett Davin M | $305,428 |
Source: Public Records
Tax History Compared to Growth
Tax History
| Year | Tax Paid | Tax Assessment Tax Assessment Total Assessment is a certain percentage of the fair market value that is determined by local assessors to be the total taxable value of land and additions on the property. | Land | Improvement |
|---|---|---|---|---|
| 2024 | $3,980 | $393,700 | $53,100 | $340,600 |
| 2023 | $3,955 | $395,500 | $53,000 | $342,500 |
| 2022 | $3,992 | $399,200 | $53,000 | $346,200 |
| 2021 | $3,490 | $349,000 | $30,500 | $318,500 |
| 2020 | $2,535 | $253,500 | $21,900 | $231,600 |
| 2019 | $2,501 | $250,100 | $21,900 | $228,200 |
| 2018 | $2,607 | $247,400 | $21,900 | $225,500 |
| 2017 | $2,667 | $242,100 | $21,900 | $220,200 |
| 2016 | $2,814 | $244,400 | $21,900 | $222,500 |
| 2014 | $7 | $300 | $300 | $0 |
Source: Public Records
Map
Nearby Homes
- 60506 Woodstock Dr
- 17866 Bellows Falls Dr
- 17746 Hartman St
- 5725 Aberdeen Ct
- 1927 E Farnsworth Dr
- 6020 Old English Ct
- 1835 Stonehedge Ln
- 5002 Heather Ln
- 1839 Renfrew Dr
- 1725 Thornhill Dr
- 1719 Thornhill Dr
- 1713 Thornhill Dr
- 17303 Ireland Rd
- 6235 York Rd
- 4555 Macdougall Ct
- 1411 Cambridge Dr
- 1515 Strathmore Ct
- 6244 Regent Ct
- 5305 Monticello Ct
- 5428 Raleigh Dr
- 2623 Running Deer Dr Unit 25
- 2615 Running Deer Dr Unit 26
- 2615 Running Deer Dr
- 2631 Running Deer Dr Unit 24
- 2605 Running Deer Dr
- 2713 Redfawn Ct
- 5446 Deer Hollow Dr
- 2525 Running Deer Dr Unit 28
- 2721 Redfawn Ct
- 5441 Deer Hollow Dr Unit 14
- 5554 Deer Hollow Dr
- 2716 Red Fawn Ct
- 2811 Redfawn Ct Unit 21
- 5549 Deer Hollow Dr
- 2716 Redfawn Ct
- 2528 Running Deer Dr Unit 32
- 2528 Running Deer Dr
- 2515 Running Deer Dr
- 5614 Deer Hollow Dr
- 2520 Running Deer Dr Unit 31