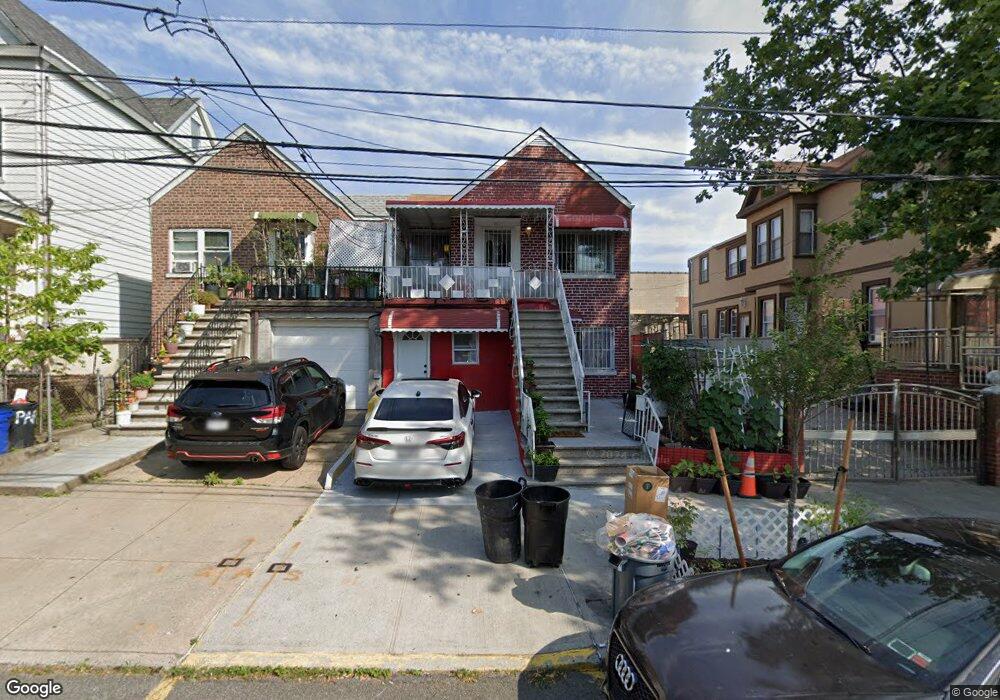
2623 Saint Raymonds Ave Bronx, NY 10461
Westchester Square NeighborhoodEstimated Value: $718,049 - $817,000
Studio
--
Bath
1,846
Sq Ft
$423/Sq Ft
Est. Value
About This Home
This home is located at 2623 Saint Raymonds Ave, Bronx, NY 10461 and is currently estimated at $780,762, approximately $422 per square foot. 2623 Saint Raymonds Ave is a home located in Bronx County with nearby schools including P.S. 108 Philip J Abinanti, J.H.S. 144 Michelangelo, and Herbert H Lehman High School.
Ownership History
Date
Name
Owned For
Owner Type
Purchase Details
Closed on
Aug 6, 2025
Sold by
Chowdhury Marruf
Bought by
Chowdhury Amirun Naheen and Chowdhury Marufa Aukter
Current Estimated Value
Purchase Details
Closed on
Feb 25, 2005
Sold by
Chowdhury Maruf
Bought by
Chowdhury Marruf
Home Financials for this Owner
Home Financials are based on the most recent Mortgage that was taken out on this home.
Original Mortgage
$204,000
Outstanding Balance
$104,355
Interest Rate
5.95%
Mortgage Type
Purchase Money Mortgage
Estimated Equity
$676,407
Purchase Details
Closed on
Aug 3, 2001
Sold by
Muniz Carlos
Bought by
Chowdhury Maruf
Home Financials for this Owner
Home Financials are based on the most recent Mortgage that was taken out on this home.
Original Mortgage
$164,000
Interest Rate
6.7%
Purchase Details
Closed on
Aug 13, 1999
Sold by
Muniz Carlos and Muniz Estrella
Bought by
Muniz Carlos
Home Financials for this Owner
Home Financials are based on the most recent Mortgage that was taken out on this home.
Original Mortgage
$113,000
Interest Rate
7.73%
Create a Home Valuation Report for This Property
The Home Valuation Report is an in-depth analysis detailing your home's value as well as a comparison with similar homes in the area
Home Values in the Area
Average Home Value in this Area
Purchase History
| Date | Buyer | Sale Price | Title Company |
|---|---|---|---|
| Chowdhury Amirun Naheen | -- | -- | |
| Chowdhury Marruf | -- | -- | |
| Chowdhury Marruf | -- | -- | |
| Chowdhury Maruf | -- | -- | |
| Chowdhury Maruf | -- | -- | |
| Muniz Carlos | $75,000 | Chicago Title Insurance Co | |
| Muniz Carlos | -- | Chicago Title Insurance Co |
Source: Public Records
Mortgage History
| Date | Status | Borrower | Loan Amount |
|---|---|---|---|
| Open | Chowdhury Marruf | $204,000 | |
| Closed | Chowdhury Marruf | $204,000 | |
| Previous Owner | Chowdhury Maruf | $164,000 | |
| Previous Owner | Muniz Carlos | $113,000 |
Source: Public Records
Tax History
| Year | Tax Paid | Tax Assessment Tax Assessment Total Assessment is a certain percentage of the fair market value that is determined by local assessors to be the total taxable value of land and additions on the property. | Land | Improvement |
|---|---|---|---|---|
| 2025 | $5,692 | $30,038 | $5,928 | $24,110 |
| 2024 | $5,692 | $28,339 | $5,070 | $23,269 |
| 2023 | $5,755 | $28,339 | $5,771 | $22,568 |
| 2022 | $5,614 | $37,260 | $8,040 | $29,220 |
| 2021 | $5,584 | $35,580 | $8,040 | $27,540 |
| 2020 | $5,299 | $32,880 | $8,040 | $24,840 |
| 2019 | $4,940 | $30,600 | $8,040 | $22,560 |
| 2018 | $4,814 | $23,616 | $6,634 | $16,982 |
| 2017 | $4,778 | $23,437 | $6,682 | $16,755 |
| 2016 | $4,420 | $22,111 | $7,444 | $14,667 |
| 2015 | $2,910 | $20,860 | $8,731 | $12,129 |
| 2014 | $2,910 | $19,680 | $8,940 | $10,740 |
Source: Public Records
Map
Nearby Homes
- 1625 Overing St
- 1541 Overing St
- 1506 Overing St Unit 6-C
- 1715 Saint Peters Ave
- 2474 Saint Raymond Ave
- 1624 Seddon St
- 2470 Glebe Ave
- 1458 Rowland St
- 2437 Buck St
- 2415 Saint Raymond Ave
- 1038 Pierce Ave
- 1629 Haight Ave
- 1007 Sackett Ave
- 1003 Sackett Ave
- 2806 Wellman Ave
- 2403 Buck St
- 1619 Mulford Ave
- 1705 Zerega Ave
- 1707 Zerega Ave
- 1521 Zerega Ave
- 2621 Saint Raymonds Ave
- 2627 Saint Raymonds Ave
- 2619 Saint Raymonds Ave
- 2620 Saint Raymonds Ave
- 2622 Chesbrough Ave
- 1451 St Raymond Ave
- 2616 Chesbrough Ave
- 2614 Chesbrough Ave
- 2612 Chesbrough Ave
- 2628 Saint Raymonds Ave
- 1455-1461 Blondell Ave
- 2610 Chesbrough Ave
- 2601 Saint Raymonds Ave
- 2618 Saint Raymonds Ave
- 2616 Saint Raymonds Ave
- 1437 Blondell Ave
- 2610 Saint Raymonds Ave
- 2601 Saint Raymonds Ave
- 1466 Williamsbridge Rd
- 1468 Williamsbridge Rd
Your Personal Tour Guide
Ask me questions while you tour the home.