
Seller's Agent in 2025
Christine Hjorth
Keller Williams North Shore West
(847) 738-2087
1 in this area
138 Total Sales
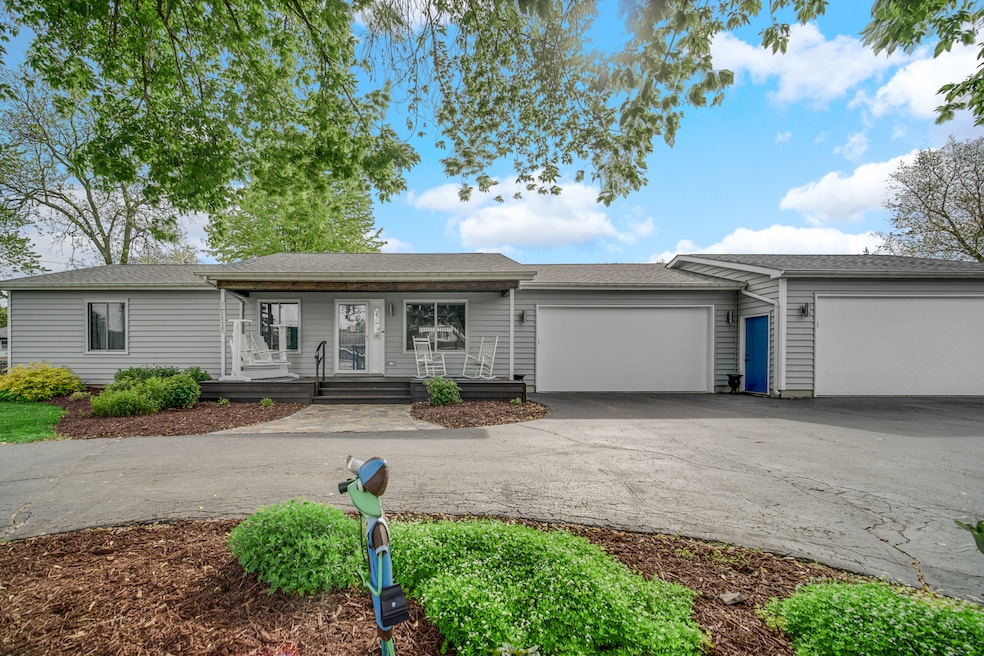
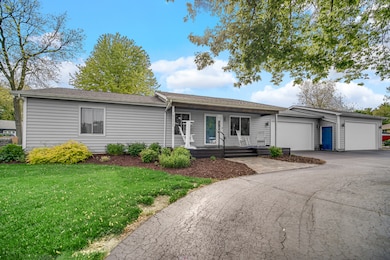
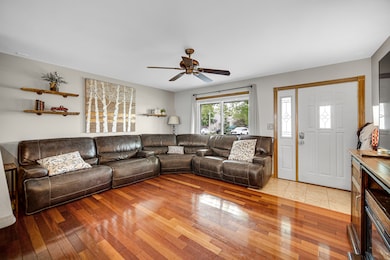
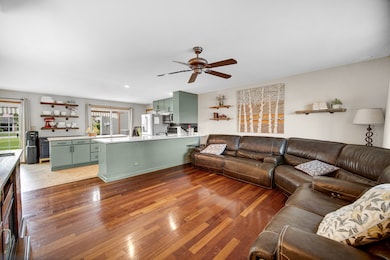
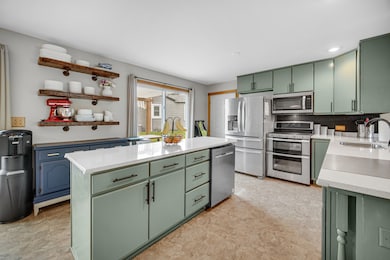
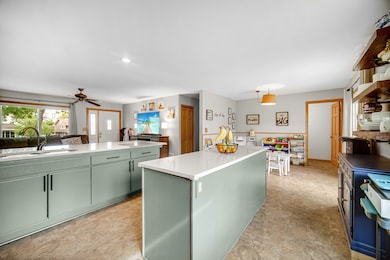
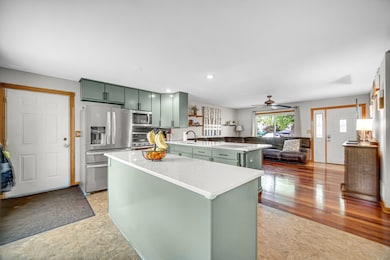
Welcome to this beautifully updated 3-bedroom, 3-bath ranch home that seamlessly blends modern comfort with exceptional functionality. Upon entry, you're greeted by a bright, freshly painted open-concept layout, enhanced by tasteful updates throughout. The spacious kitchen features new countertops and a large island-ideal for both daily living and entertaining. The fully finished basement offers a generous extension of the living space, complete with a full bathroom, utility room, and ample storage. One of the standout features of this property is its two separate 2-car garages, providing a rare 4-car covered parking capacity-perfect for car enthusiasts, hobbyists, or those in need of additional storage. Enjoy three separate outdoor living areas (patio and two decks) set on a beautifully landscaped lot-ideal for relaxing or entertaining. A dedicated RV/boat parking pad and two storage sheds add more value and convenience. Located near the Chain O' Lakes and local schools, this move-in-ready home is perfectly suited for a wide range of lifestyles. This property has too many updates to list, making it a must-see!
Last Agent to Sell the Property
Keller Williams North Shore West License #475185143 Listed on: 05/20/2025
| Date | Type | Sale Price | Title Company |
|---|---|---|---|
| Warranty Deed | $360,000 | First American Title | |
| Interfamily Deed Transfer | $80,000 | Multiple | |
| Interfamily Deed Transfer | -- | None Available | |
| Interfamily Deed Transfer | -- | None Available |
| Date | Status | Loan Amount | Loan Type |
|---|---|---|---|
| Open | $232,500 | New Conventional | |
| Previous Owner | $171,839 | FHA |
| Date | Event | Price | List to Sale | Price per Sq Ft |
|---|---|---|---|---|
| 07/15/2025 07/15/25 | Sold | $360,000 | +2.9% | $286 / Sq Ft |
| 05/20/2025 05/20/25 | For Sale | $349,900 | -- | $278 / Sq Ft |
| Year | Tax Paid | Tax Assessment Tax Assessment Total Assessment is a certain percentage of the fair market value that is determined by local assessors to be the total taxable value of land and additions on the property. | Land | Improvement |
|---|---|---|---|---|
| 2024 | $5,684 | $86,220 | $16,728 | $69,492 |
| 2023 | $5,768 | $81,225 | $15,759 | $65,466 |
| 2022 | $5,768 | $78,629 | $11,230 | $67,399 |
| 2021 | $5,548 | $74,115 | $10,585 | $63,530 |
| 2020 | $5,580 | $73,056 | $10,434 | $62,622 |
| 2019 | $5,386 | $70,058 | $10,006 | $60,052 |
| 2018 | $4,861 | $63,737 | $11,282 | $52,455 |
| 2017 | $4,747 | $58,912 | $10,428 | $48,484 |
| 2016 | $5,600 | $53,879 | $9,537 | $44,342 |
| 2015 | $5,875 | $50,279 | $8,900 | $41,379 |
| 2014 | $5,312 | $45,838 | $10,849 | $34,989 |
| 2012 | $4,359 | $48,594 | $11,306 | $37,288 |
Seller's Agent in 2025
Christine Hjorth
Keller Williams North Shore West
(847) 738-2087
1 in this area
138 Total Sales
E
Seller Co-Listing Agent in 2025
Erik Jensen
Keller Williams North Shore West
(630) 774-9190
1 in this area
11 Total Sales
Buyer's Agent in 2025
Jim Starwalt
Better Homes and Gardens Real Estate Star Homes
(847) 650-9139
26 in this area
1,589 Total Sales
Source: Midwest Real Estate Data (MRED)
MLS Number: 12369984
APN: 05-11-204-046
Disclaimer: Certain information contained herein is derived from information provided by parties other than Homes.com. All information provided is deemed reliable, but is not guaranteed to be accurate and should be independently verified.
![]() Based on information submitted to the MLS GRID. All data is obtained from various sources and may not have been verified by broker or MLS GRID. Supplied Open House Information is subject to change without notice. All information should be independently reviewed and verified for accuracy. Properties may or may not be listed by the office/agent presenting the information. Some IDX listings have been excluded from this website.
Based on information submitted to the MLS GRID. All data is obtained from various sources and may not have been verified by broker or MLS GRID. Supplied Open House Information is subject to change without notice. All information should be independently reviewed and verified for accuracy. Properties may or may not be listed by the office/agent presenting the information. Some IDX listings have been excluded from this website.
The Digital Millennium Copyright Act of 1998, 17 U.S.C. § 512 (the “DMCA”) provides recourse for copyright owners who believe that material appearing on the Internet infringes their rights under U.S. copyright law. If you believe in good faith that any content or material made available in connection with our website or services infringes your copyright, you (or your agent) may send us a notice requesting that the content or material be removed, or access to it blocked.
Notices must be sent in writing by email to DMCAnotice@MLSGrid.com.
The DMCA requires that your notice of alleged copyright infringement include the following information:
(1) description of the copyrighted work that is the subject of claimed infringement;
(2) description of the alleged infringing content and information sufficient to permit us to locate the content;
(3) contact information for you, including your address, telephone number and email address;
(4) a statement by you that you have a good faith belief that the content in the manner complained of is not authorized by the copyright owner, or its agent, or by the operation of any law;
(5) a statement by you, signed under penalty of perjury, that the information in the notification is accurate and that you have the authority to enforce the copyrights that are claimed to be infringed; and
(6) a physical or electronic signature of the copyright owner or a person authorized to act on the copyright owner’s behalf. Failure to include all of the above information may result in the delay of the processing of your complaint.