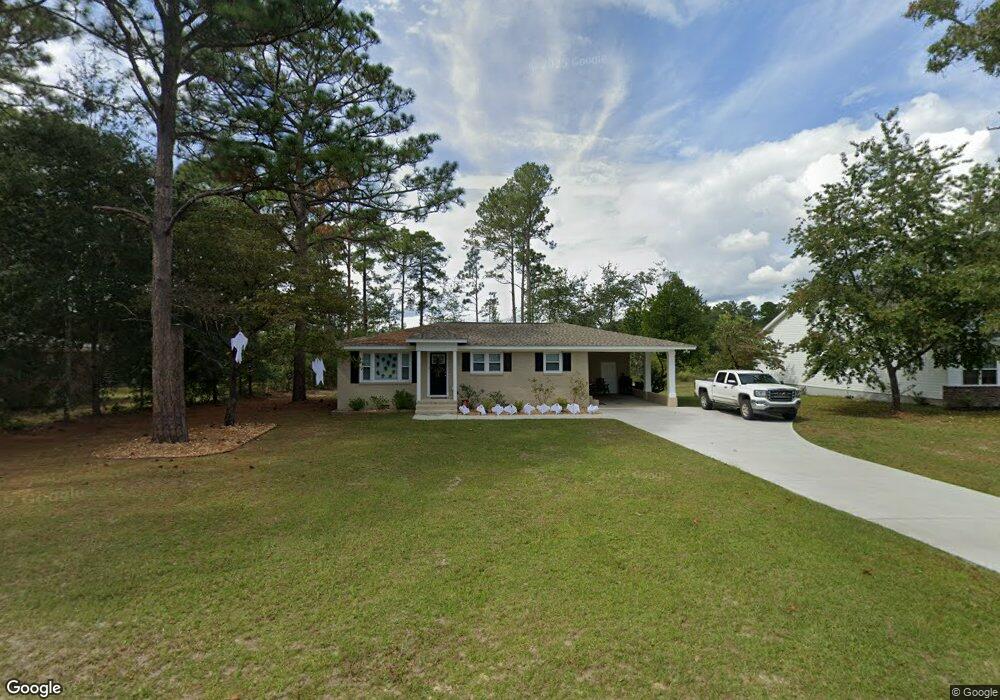
2624 Old Charleston Rd Georgetown, SC 29440
Estimated Value: $261,000 - $392,000
3
Beds
2
Baths
1,170
Sq Ft
$254/Sq Ft
Est. Value
About This Home
This home is located at 2624 Old Charleston Rd, Georgetown, SC 29440 and is currently estimated at $297,671, approximately $254 per square foot. 2624 Old Charleston Rd is a home located in Georgetown County with nearby schools including Maryville Elementary School, Georgetown Middle School, and Georgetown High School.
Ownership History
Date
Name
Owned For
Owner Type
Purchase Details
Closed on
Jul 18, 2024
Sold by
Beverly Homes Llc
Bought by
Cooper Cory A
Current Estimated Value
Home Financials for this Owner
Home Financials are based on the most recent Mortgage that was taken out on this home.
Original Mortgage
$270,008
Outstanding Balance
$266,632
Interest Rate
6.75%
Mortgage Type
FHA
Estimated Equity
$31,039
Purchase Details
Closed on
Jul 27, 2023
Sold by
Taylor Betty Marie and Smith David Layton
Bought by
Beverly Homes Llc
Purchase Details
Closed on
Jun 16, 2023
Sold by
Marsh Rosie Brian
Bought by
Taylor Betty Marie
Purchase Details
Closed on
Jan 24, 2023
Sold by
Ard Marsh Leona
Bought by
Marsh Roger Brian and Smith Ian David
Create a Home Valuation Report for This Property
The Home Valuation Report is an in-depth analysis detailing your home's value as well as a comparison with similar homes in the area
Home Values in the Area
Average Home Value in this Area
Purchase History
| Date | Buyer | Sale Price | Title Company |
|---|---|---|---|
| Cooper Cory A | $274,990 | None Listed On Document | |
| Beverly Homes Llc | $175,000 | None Listed On Document | |
| Taylor Betty Marie | -- | None Listed On Document | |
| Taylor Betty Marie | -- | None Listed On Document | |
| Marsh Roger Brian | -- | -- |
Source: Public Records
Mortgage History
| Date | Status | Borrower | Loan Amount |
|---|---|---|---|
| Open | Cooper Cory A | $270,008 |
Source: Public Records
Tax History Compared to Growth
Tax History
| Year | Tax Paid | Tax Assessment Tax Assessment Total Assessment is a certain percentage of the fair market value that is determined by local assessors to be the total taxable value of land and additions on the property. | Land | Improvement |
|---|---|---|---|---|
| 2024 | $4,693 | $12,730 | $2,400 | $10,330 |
| 2023 | $4,693 | $3,758 | $711 | $3,047 |
| 2022 | $409 | $3,758 | $711 | $3,047 |
| 2021 | $396 | $3,758 | $711 | $3,047 |
| 2020 | $396 | $4,228 | $800 | $3,428 |
| 2019 | $296 | $3,268 | $620 | $2,648 |
| 2018 | $296 | $32,680 | $0 | $0 |
| 2017 | $236 | $32,680 | $0 | $0 |
| 2016 | $233 | $3,268 | $0 | $0 |
| 2015 | $220 | $0 | $0 | $0 |
| 2014 | $220 | $76,900 | $13,500 | $63,400 |
| 2012 | -- | $76,900 | $13,500 | $63,400 |
Source: Public Records
Map
Nearby Homes
- 2510 Redwood St
- 2405 S Island Rd
- 821 Cedar St
- 809 Cedar St
- 811 Spruce St
- 2315 Withers St Unit Lot C Abaco Plan
- 418 Grain Field Dr
- 2206 Beck St
- Lot 54 Grassland Ln
- Lot 404 Two Rivers Rd
- 531 Charlton Blvd
- 523 Charlton Blvd
- 308 Concorde Dr
- 3143 S Island Rd
- The Abaco Plan at Harbor Club
- The Pinckney Plan at Harbor Club
- The Indigo Plan at Harbor Club
- The Sullivan Plan at Harbor Club
- The Abaco II Plan at Harbor Club
- The Live Oak II Plan at Harbor Club
- 2624 Old Charleston Rd Unit Lot 5
- 2628 Old Charleston Rd
- Lot D Old Charleston Rd
- 2627 Old Charleston Rd
- 2620 Old Charleston Rd
- 2621 Old Charleston Rd
- 2622 Old Charleston Rd Unit Lot 4 Sullivan Plan
- 2704 Old Charleston Rd
- 2701 Old Charleston Rd
- 2625 Old Charleston Rd
- 2625 Old Charleston Rd Unit Lot 5 Poplar Plan
- 2615 Old Charleston Rd
- 2616 Old Charleston Rd
- 2705 Old Charleston Rd
- 2708 Old Charleston Rd
- 2628 Beaty St
- Tbd Beaty St St
- lot 8 Beaty St
- 2622 Beaty St Unit Lot 9 Santee Plan
- 2709 Old Charleston Rd