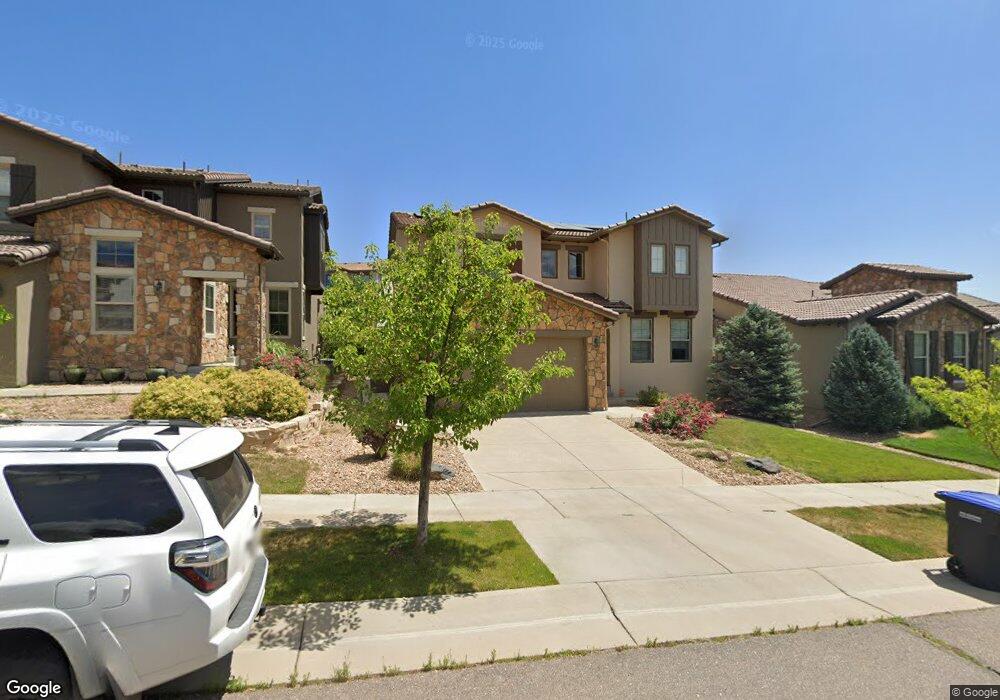
2624 S Kilmer St Lakewood, CO 80228
Rooney Valley NeighborhoodEstimated Value: $1,061,000 - $1,166,000
4
Beds
4
Baths
3,781
Sq Ft
$294/Sq Ft
Est. Value
About This Home
This home is located at 2624 S Kilmer St, Lakewood, CO 80228 and is currently estimated at $1,111,534, approximately $293 per square foot. 2624 S Kilmer St is a home located in Jefferson County with nearby schools including Rooney Ranch Elementary School, Dunstan Middle School, and Green Mountain High School.
Ownership History
Date
Name
Owned For
Owner Type
Purchase Details
Closed on
Oct 15, 2022
Sold by
Unknown
Bought by
Shannon Marie Henry Revocable Living Trust
Current Estimated Value
Purchase Details
Closed on
Jun 7, 2019
Sold by
Toffolo D Arcy L and Toffolo Christopher Marc
Bought by
Bragg Shannon M and Bragg Nathan W
Home Financials for this Owner
Home Financials are based on the most recent Mortgage that was taken out on this home.
Original Mortgage
$447,300
Interest Rate
4.2%
Mortgage Type
New Conventional
Purchase Details
Closed on
Sep 5, 2014
Sold by
Toffolo Darcy L
Bought by
Toffolo Darcy L and Toffolo Christopher Marc
Purchase Details
Closed on
Nov 6, 2013
Sold by
Gardell Homes Us Limited Partnership
Bought by
Toffolo Darcy L
Home Financials for this Owner
Home Financials are based on the most recent Mortgage that was taken out on this home.
Original Mortgage
$75,500
Interest Rate
4.37%
Mortgage Type
Stand Alone Second
Create a Home Valuation Report for This Property
The Home Valuation Report is an in-depth analysis detailing your home's value as well as a comparison with similar homes in the area
Home Values in the Area
Average Home Value in this Area
Purchase History
| Date | Buyer | Sale Price | Title Company |
|---|---|---|---|
| Shannon Marie Henry Revocable Living Trust | -- | -- | |
| Bragg Shannon M | $745,500 | Land Title Guarantee Co | |
| Toffolo Darcy L | -- | None Available | |
| Toffolo Darcy L | $503,932 | Land Title Guarantee Company |
Source: Public Records
Mortgage History
| Date | Status | Borrower | Loan Amount |
|---|---|---|---|
| Previous Owner | Bragg Shannon M | $447,300 | |
| Previous Owner | Toffolo Darcy L | $75,500 |
Source: Public Records
Tax History Compared to Growth
Tax History
| Year | Tax Paid | Tax Assessment Tax Assessment Total Assessment is a certain percentage of the fair market value that is determined by local assessors to be the total taxable value of land and additions on the property. | Land | Improvement |
|---|---|---|---|---|
| 2024 | $9,229 | $62,917 | $18,136 | $44,781 |
| 2023 | $9,229 | $62,917 | $18,136 | $44,781 |
| 2022 | $8,127 | $54,637 | $17,751 | $36,886 |
| 2021 | $8,326 | $56,210 | $18,262 | $37,948 |
| 2020 | $7,560 | $49,844 | $13,650 | $36,194 |
| 2019 | $7,734 | $49,844 | $13,650 | $36,194 |
| 2018 | $7,785 | $51,213 | $13,648 | $37,565 |
| 2017 | $7,515 | $51,213 | $13,648 | $37,565 |
| 2016 | $7,179 | $48,821 | $9,148 | $39,673 |
| 2015 | $6,504 | $48,821 | $9,148 | $39,673 |
| 2014 | $6,504 | $42,366 | $7,438 | $34,928 |
Source: Public Records
Map
Nearby Homes
- 15274 W La Salle Ave
- 15116 W Harvard Cir
- 15523 W Washburn Dr
- 2385 S Loveland Way
- 15527 W Washburn Dr
- 15533 W Washburn Dr
- 15564 W Washburn Ave
- 15553 W Washburn Dr
- 15558 W Washburn Ave
- 15568 W Washburn Ave
- Cadence Eleven Plan at Cadence at Solterra - Cadence
- Cadence Twelve Plan at Cadence at Solterra - Cadence
- 2347 S Loveland St
- 15295 W Baker Ave
- 15514 W La Salle Ave
- 14630 W Amherst Place
- 15585 W La Salle Ave
- 2914 S Poppy St
- 2855 S Poppy St
- 2968 S Poppy St
- 2614 S Kilmer St
- 2634 S Kilmer St
- 2594 S Kilmer St
- 2633 S Kilmer Ct
- 2619 S Kilmer St
- 2621 S Kilmer Ct
- 15199 W Washburn Ave
- 2641 S Kilmer Ct
- 2629 S Kilmer St
- 2609 S Kilmer St
- 2574 S Kilmer St
- 2599 S Kilmer St
- 2639 S Kilmer St
- 2613 S Kilmer Ct
- 15195 W Washburn Ave
- 2589 S Kilmer St
- 15198 W Washburn Ave
- 15208 W La Salle Ave
- 2579 S Kilmer St
- 2601 S Kilmer Ct