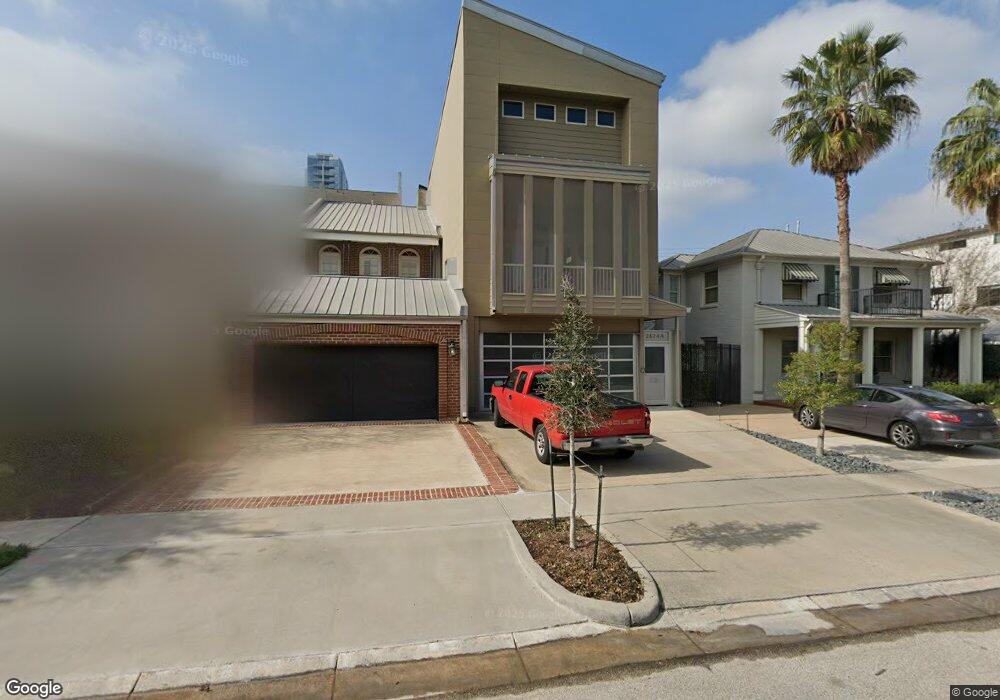
2624 Westgate St Unit A Houston, TX 77098
River Oaks NeighborhoodEstimated Value: $858,892 - $1,032,000
3
Beds
3
Baths
3,684
Sq Ft
$265/Sq Ft
Est. Value
About This Home
This home is located at 2624 Westgate St Unit A, Houston, TX 77098 and is currently estimated at $975,223, approximately $264 per square foot. 2624 Westgate St Unit A is a home located in Harris County with nearby schools including Poe Elementary School, Lanier Middle School, and Lamar High School.
Ownership History
Date
Name
Owned For
Owner Type
Purchase Details
Closed on
Jun 12, 2019
Sold by
Nolan Sean T and Nolan Carol R
Bought by
Lowman Christopher J and Lowman Sara A
Current Estimated Value
Home Financials for this Owner
Home Financials are based on the most recent Mortgage that was taken out on this home.
Original Mortgage
$611,100
Outstanding Balance
$537,306
Interest Rate
4.1%
Mortgage Type
New Conventional
Estimated Equity
$437,917
Purchase Details
Closed on
Oct 26, 2005
Sold by
Wasserberg Daniel J
Bought by
Nolan Sean T and Nolan Carol R
Purchase Details
Closed on
Jun 24, 2004
Sold by
Hubbard William Daniel
Bought by
Wasserberg Daniel J
Home Financials for this Owner
Home Financials are based on the most recent Mortgage that was taken out on this home.
Original Mortgage
$288,000
Interest Rate
6.32%
Mortgage Type
Purchase Money Mortgage
Create a Home Valuation Report for This Property
The Home Valuation Report is an in-depth analysis detailing your home's value as well as a comparison with similar homes in the area
Home Values in the Area
Average Home Value in this Area
Purchase History
| Date | Buyer | Sale Price | Title Company |
|---|---|---|---|
| Lowman Christopher J | -- | Stewart Title | |
| Nolan Sean T | -- | Chicago Title Insurance Co | |
| Wasserberg Daniel J | -- | Texas American Title Company |
Source: Public Records
Mortgage History
| Date | Status | Borrower | Loan Amount |
|---|---|---|---|
| Open | Lowman Christopher J | $611,100 | |
| Previous Owner | Wasserberg Daniel J | $288,000 | |
| Closed | Wasserberg Daniel J | $36,000 |
Source: Public Records
Tax History Compared to Growth
Tax History
| Year | Tax Paid | Tax Assessment Tax Assessment Total Assessment is a certain percentage of the fair market value that is determined by local assessors to be the total taxable value of land and additions on the property. | Land | Improvement |
|---|---|---|---|---|
| 2025 | $12,356 | $764,704 | $304,923 | $459,781 |
| 2024 | $12,356 | $788,688 | $304,923 | $483,765 |
| 2023 | $12,356 | $785,065 | $304,923 | $480,142 |
| 2022 | $16,336 | $746,741 | $251,893 | $494,848 |
| 2021 | $15,719 | $674,456 | $251,893 | $422,563 |
| 2020 | $16,608 | $685,818 | $251,893 | $433,925 |
| 2019 | $17,217 | $680,400 | $168,090 | $512,310 |
| 2018 | $13,540 | $680,400 | $168,090 | $512,310 |
| 2017 | $19,599 | $775,107 | $210,225 | $564,882 |
| 2016 | $19,599 | $800,000 | $210,225 | $589,775 |
| 2015 | $14,331 | $704,643 | $182,195 | $522,448 |
| 2014 | $14,331 | $743,582 | $182,195 | $561,387 |
Source: Public Records
Map
Nearby Homes
- 2650 Westgate St
- 2817 Newman St
- 2322 Steel St Unit 19
- 2615 Newman St
- 2313 Steel St
- 2700 Revere St Unit 109
- 2700 Revere St Unit 147
- 2621 Greenbriar Dr
- 2521 Westgate Dr
- 2522 Kingston St
- 2514 Westgate Dr
- 2509 Westgate Dr
- 2628 Peckham St
- 2244 Sul Ross St
- 2727 Kirby Dr Unit 19F
- 2727 Kirby Dr Unit 13C
- 2727 Kirby Dr Unit 17D
- 2727 Kirby Dr Unit 27J
- 2727 Kirby Dr Unit 24E
- 2120 Kipling St Unit 406
- 2624 Westgate St Unit B
- 2624 Westgate St
- 2624B Westgate St
- 2624 Westgate Dr
- 2626 Westgate St
- 2622 Westgate St
- 2630 Westgate St
- 2632 Westgate St
- 2616 Westgate St
- 2616 Westgate St
- 2638 Westgate St
- 2612 Westgate St
- 2640 Westgate St
- 2627 Westgate St
- 2625 Westgate St
- 2629 Westgate St
- 2629 Westgate St Unit A
- 2629 Westgate St Unit B
- 2629 Westgate Dr Unit B
- 2623 Westgate St