Estimated Value: $124,000 - $436,742
--
Bed
--
Bath
--
Sq Ft
6.13
Acres
About This Home
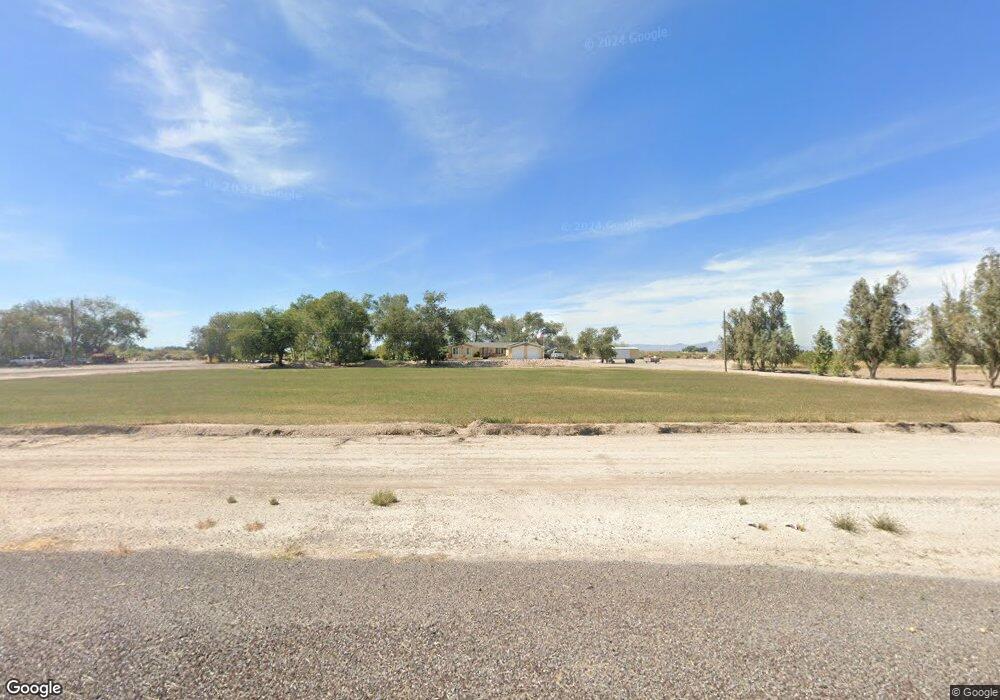
This home is located at 2625 N 2000 W, Delta, UT 84624 and is currently estimated at $322,914. 2625 N 2000 W is a home.
Ownership History
Date
Name
Owned For
Owner Type
Purchase Details
Closed on
Jun 30, 2021
Sold by
Smith Richard L and Smith Merrie Jo
Bought by
Smith Richard L and Smith Merrie Jo
Current Estimated Value
Home Financials for this Owner
Home Financials are based on the most recent Mortgage that was taken out on this home.
Original Mortgage
$121,590
Outstanding Balance
$109,845
Interest Rate
2.9%
Mortgage Type
New Conventional
Estimated Equity
$213,069
Purchase Details
Closed on
Sep 21, 2010
Sold by
Smith Merrie Jo
Bought by
Smith Richard L and Smith Merrie Jo
Home Financials for this Owner
Home Financials are based on the most recent Mortgage that was taken out on this home.
Original Mortgage
$108,000
Interest Rate
4.28%
Create a Home Valuation Report for This Property
The Home Valuation Report is an in-depth analysis detailing your home's value as well as a comparison with similar homes in the area
Home Values in the Area
Average Home Value in this Area
Purchase History
| Date | Buyer | Sale Price | Title Company |
|---|---|---|---|
| Smith Richard L | -- | First American Title | |
| Smith Richard L | -- | -- | |
| Smith Merrie Jo | -- | -- |
Source: Public Records
Mortgage History
| Date | Status | Borrower | Loan Amount |
|---|---|---|---|
| Open | Smith Richard L | $121,590 | |
| Closed | Smith Merrie Jo | $108,000 |
Source: Public Records
Tax History Compared to Growth
Tax History
| Year | Tax Paid | Tax Assessment Tax Assessment Total Assessment is a certain percentage of the fair market value that is determined by local assessors to be the total taxable value of land and additions on the property. | Land | Improvement |
|---|---|---|---|---|
| 2025 | $2,141 | $263,650 | $23,354 | $240,296 |
| 2024 | $2,141 | $240,025 | $16,418 | $223,607 |
| 2023 | $2,410 | $240,025 | $16,418 | $223,607 |
| 2022 | $1,759 | $155,801 | $16,250 | $139,551 |
| 2021 | $1,400 | $119,660 | $14,650 | $105,010 |
| 2020 | $1,342 | $115,531 | $14,650 | $100,881 |
| 2019 | $1,294 | $112,381 | $14,650 | $97,731 |
| 2018 | $1,134 | $100,974 | $14,650 | $86,324 |
| 2017 | $1,147 | $97,674 | $11,350 | $86,324 |
| 2016 | $1,095 | $97,674 | $11,350 | $86,324 |
| 2015 | $1,095 | $97,674 | $11,350 | $86,324 |
| 2014 | -- | $97,674 | $11,350 | $86,324 |
| 2013 | -- | $84,354 | $11,350 | $73,004 |
Source: Public Records
Map
Nearby Homes
- 9000 W 1500 Rd N
- 98 W 1000 N
- 451 W 300 N
- 331 W 200 N
- 325 N 100 W
- 435 W 100 S
- 242 S 400 W
- 4340 W 5000 N
- 163 W 100 S
- 901 E 750 Rd N
- 294 S 300 W
- 0 E Highway 6 Unit LotWP001 16586023
- 7900 E 250 Rd N
- 445 Topaz Blvd Unit 10
- 461 Topaz Blvd Unit 6
- 44 E 300 S
- 628 Sunset St
- 629 E Millard St
- 328 S Center St
- 32 E 300 S