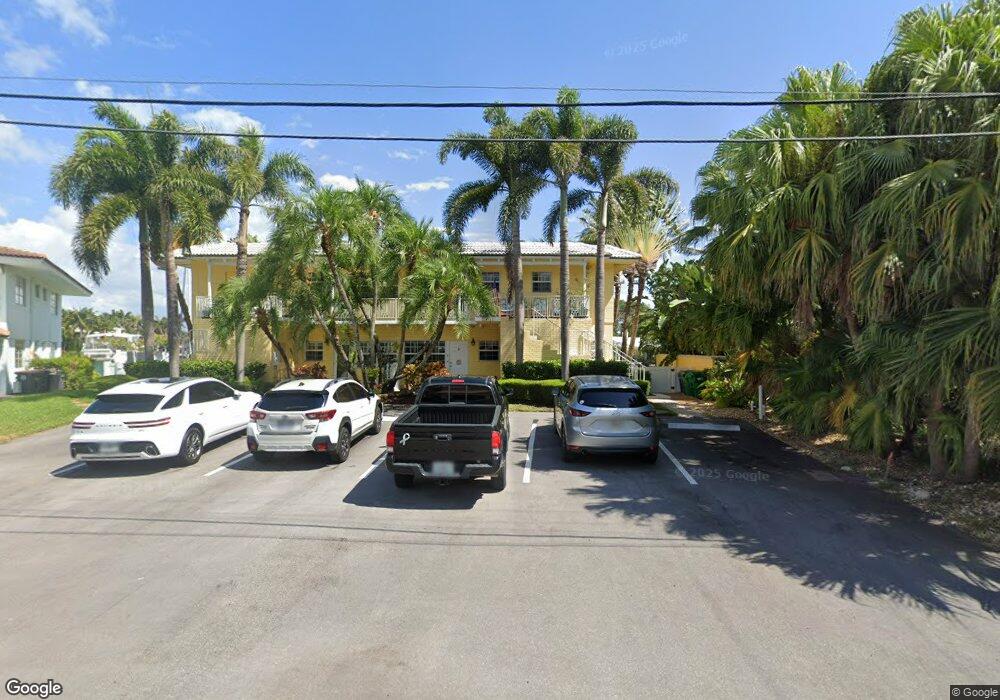
2625 NE 28th Ct Unit D Lighthouse Point, FL 33064
Estimated Value: $364,264 - $803,000
2
Beds
2
Baths
1,400
Sq Ft
$373/Sq Ft
Est. Value
About This Home
This home is located at 2625 NE 28th Ct Unit D, Lighthouse Point, FL 33064 and is currently estimated at $522,566, approximately $373 per square foot. 2625 NE 28th Ct Unit D is a home located in Broward County with nearby schools including Norcrest Elementary School, Deerfield Beach Middle School, and Deerfield Beach High School.
Ownership History
Date
Name
Owned For
Owner Type
Purchase Details
Closed on
Sep 14, 2012
Sold by
Bond Arthur H and Bond Deborah
Bought by
Ara Nicholas and Dagostino Beverly
Current Estimated Value
Home Financials for this Owner
Home Financials are based on the most recent Mortgage that was taken out on this home.
Original Mortgage
$182,000
Outstanding Balance
$126,292
Interest Rate
3.63%
Mortgage Type
New Conventional
Estimated Equity
$396,274
Purchase Details
Closed on
May 3, 2005
Sold by
Prizant Roger M
Bought by
Bond Arthur H and Bond Deborah
Home Financials for this Owner
Home Financials are based on the most recent Mortgage that was taken out on this home.
Original Mortgage
$388,000
Interest Rate
5.88%
Mortgage Type
Fannie Mae Freddie Mac
Purchase Details
Closed on
Mar 10, 2003
Sold by
Mcqueary Dennis E and Mcqueary Virginia R
Bought by
Prizant Roger M
Purchase Details
Closed on
May 1, 1993
Sold by
Available Not
Bought by
Available Not
Create a Home Valuation Report for This Property
The Home Valuation Report is an in-depth analysis detailing your home's value as well as a comparison with similar homes in the area
Home Values in the Area
Average Home Value in this Area
Purchase History
| Date | Buyer | Sale Price | Title Company |
|---|---|---|---|
| Ara Nicholas | $260,000 | Attorney | |
| Bond Arthur H | $530,000 | -- | |
| Prizant Roger M | $240,000 | -- | |
| Available Not | $121,000 | -- |
Source: Public Records
Mortgage History
| Date | Status | Borrower | Loan Amount |
|---|---|---|---|
| Open | Ara Nicholas | $182,000 | |
| Previous Owner | Bond Arthur H | $388,000 |
Source: Public Records
Tax History Compared to Growth
Tax History
| Year | Tax Paid | Tax Assessment Tax Assessment Total Assessment is a certain percentage of the fair market value that is determined by local assessors to be the total taxable value of land and additions on the property. | Land | Improvement |
|---|---|---|---|---|
| 2025 | $4,541 | $269,150 | -- | -- |
| 2024 | $4,432 | $261,570 | -- | -- |
| 2023 | $4,432 | $253,960 | $0 | $0 |
| 2022 | $3,984 | $246,570 | $0 | $0 |
| 2021 | $3,859 | $239,390 | $0 | $0 |
| 2020 | $3,735 | $236,090 | $0 | $0 |
| 2019 | $3,654 | $230,790 | $0 | $0 |
| 2018 | $3,921 | $226,490 | $0 | $0 |
| 2017 | $3,809 | $221,840 | $0 | $0 |
| 2016 | $3,789 | $217,280 | $0 | $0 |
| 2015 | $3,467 | $215,770 | $0 | $0 |
| 2014 | $3,498 | $214,060 | $0 | $0 |
| 2013 | -- | $234,000 | $23,400 | $210,600 |
Source: Public Records
Map
Nearby Homes
- 2637 NE 28th Ct
- 2735 NE 28th Ct
- 2737 NE 28th Ct Unit 1
- 2797 NE 26th Ave
- 2743 NE 28th Ct Unit 3
- 2753 NE 28th St Unit 2E
- 2737 NE 28th St Unit 7W
- 2728 NE 30th St
- 2755 NE 28th Ave Unit A3
- 2728 NE 31st St
- 2365 NE 28th St
- 2551 NE 31st Ct
- 3111 NE 27th Ave
- 2800 NE 28th St Unit 5
- 2748 NE 28th Ave Unit 13
- 3131 NE 27th Ave
- 2727 NE 31st Ct
- 2622 NE 27th Ave
- 3201 NE 27th Ave
- 2614 NE 26th Terrace
- 2625 NE 28th Ct Unit C
- 2625 NE 28th Ct Unit B
- 2625 NE 28th Ct Unit A
- 2613 NE 28th Ct Unit 2b
- 2613 NE 28th Ct Unit 1b
- 2613 NE 28th Ct
- 2645 NE 28th Ct
- 2849 NE 26th Ave
- 2731 NE 28th Ct
- 2731 NE 28th Ct Unit 2
- 2731 NE 28th Ct Unit 1
- 2731 NE 28th Ct
- 2829 NE 27th Ave
- 2833 NE 26th Ave
- 2730 NE 28th Ct
- 2951 NE 27th Ave
- 2735 NE 28th Ct Unit 2
- 2735 NE 28th Ct Unit 3
- 2735 NE 28th Ct Unit 4
- 2735 NE 28th Ct Unit Dock Space