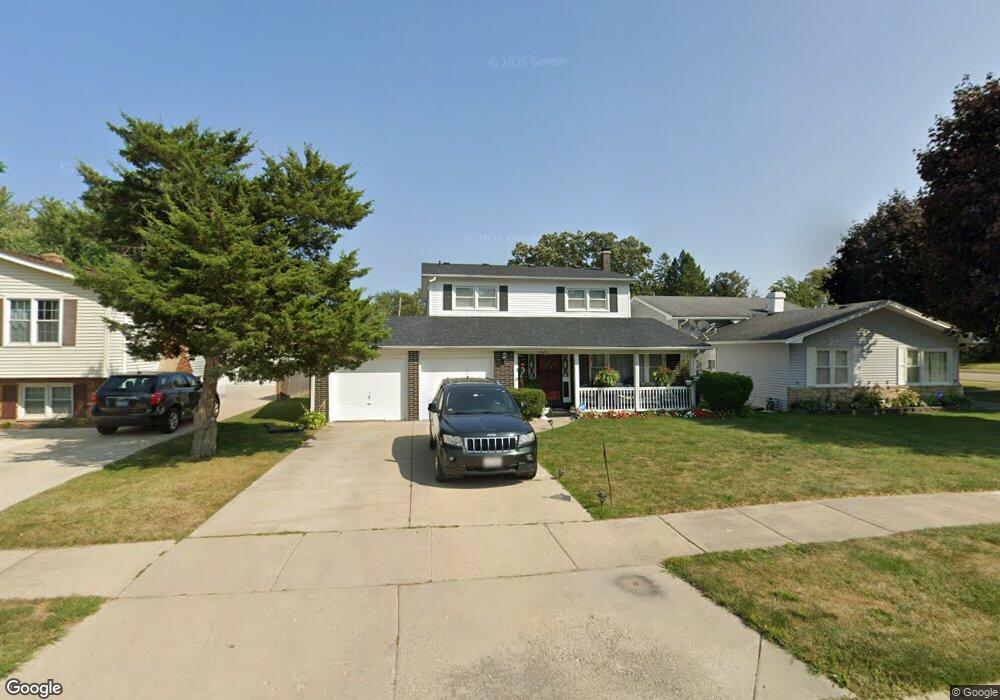
2625 Roberts Ave Waukegan, IL 60087
Estimated Value: $286,000 - $333,000
4
Beds
3
Baths
2,034
Sq Ft
$152/Sq Ft
Est. Value
About This Home
This home is located at 2625 Roberts Ave, Waukegan, IL 60087 and is currently estimated at $309,045, approximately $151 per square foot. 2625 Roberts Ave is a home located in Lake County with nearby schools including Oakdale Elementary School, Jack Benny Middle School, and Waukegan High School.
Ownership History
Date
Name
Owned For
Owner Type
Purchase Details
Closed on
Dec 13, 2023
Sold by
Johnson Ollis B and Johnson Sallie M
Bought by
Johnson Sallie M and Simpson Kiara M
Current Estimated Value
Create a Home Valuation Report for This Property
The Home Valuation Report is an in-depth analysis detailing your home's value as well as a comparison with similar homes in the area
Home Values in the Area
Average Home Value in this Area
Purchase History
| Date | Buyer | Sale Price | Title Company |
|---|---|---|---|
| Johnson Sallie M | -- | None Listed On Document |
Source: Public Records
Tax History Compared to Growth
Tax History
| Year | Tax Paid | Tax Assessment Tax Assessment Total Assessment is a certain percentage of the fair market value that is determined by local assessors to be the total taxable value of land and additions on the property. | Land | Improvement |
|---|---|---|---|---|
| 2024 | $5,525 | $83,312 | $12,744 | $70,568 |
| 2023 | $5,710 | $74,590 | $11,410 | $63,180 |
| 2022 | $5,710 | $69,409 | $11,510 | $57,899 |
| 2021 | $6,195 | $70,419 | $10,267 | $60,152 |
| 2020 | $2,205 | $65,604 | $9,565 | $56,039 |
| 2019 | $6,133 | $60,116 | $8,765 | $51,351 |
| 2018 | $4,474 | $57,567 | $11,337 | $46,230 |
| 2017 | $2,767 | $50,931 | $10,030 | $40,901 |
| 2016 | $3,006 | $40,979 | $8,070 | $32,909 |
| 2015 | $3,286 | $36,677 | $7,223 | $29,454 |
| 2014 | $3,435 | $30,455 | $6,519 | $23,936 |
| 2012 | $4,817 | $32,996 | $7,063 | $25,933 |
Source: Public Records
Map
Nearby Homes
- 2708 Dana Ave
- 2705 Dana Ave
- 12312 W Audrey Ave
- 2713 Varonen Ave
- 2613 N Lewis Ave
- 3101 Country Club Ln
- 2350 N Lewis Ave
- 36955 N Garrick Ave
- 3032 W Vermont Ave
- 1612 Whitney St
- 3320 Sunset Ave
- 3211 Rugby Ct
- 36245 N Green Bay Rd
- 1636 Rice St
- 2928 W Country Club Ave
- 3000 W Country Club Ave
- 2946 W Country Club Ave
- 1913 Chippewa Rd
- 2440 W Cheyenne Rd
- 12535 W Blanchard Rd
- 2629 Roberts Ave
- 2633 Roberts Ave
- 2620 Roberts Ave
- 2637 Roberts Ave
- 2626 Roberts Ave
- 2609 Blanchard Rd
- 2634 Roberts Ave
- 2614 Blanchard Rd
- 2609 Roberts Ave
- 2641 Roberts Ave
- 2610 Roberts Ave
- 2638 Roberts Ave
- 2625 N Evergreen Ave
- 2645 Roberts Ave
- 2621 N Evergreen Ave
- 2605 Roberts Ave
- 2629 N Evergreen Ave
- 2646 Roberts Ave
- 2635 N Mcaree Rd