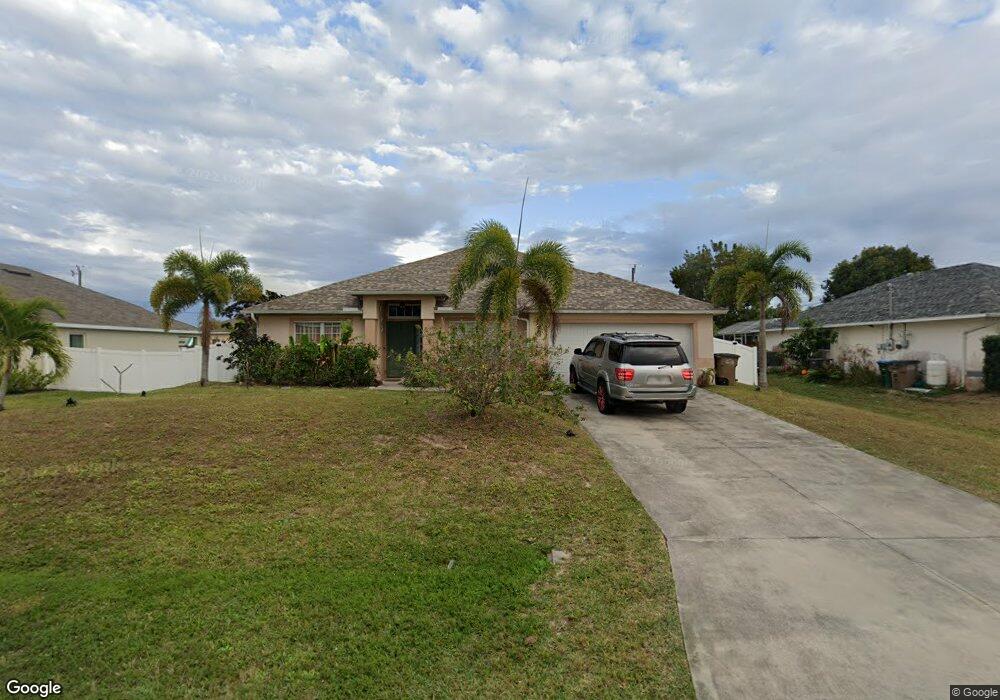
2625 SW 2nd Ave Unit 45 Cape Coral, FL 33914
Pelican NeighborhoodEstimated Value: $319,761 - $419,000
3
Beds
2
Baths
1,945
Sq Ft
$187/Sq Ft
Est. Value
About This Home
This home is located at 2625 SW 2nd Ave Unit 45, Cape Coral, FL 33914 and is currently estimated at $362,940, approximately $186 per square foot. 2625 SW 2nd Ave Unit 45 is a home located in Lee County with nearby schools including Cape Elementary School, Caloosa Elementary School, and Tropic Isles Elementary School.
Ownership History
Date
Name
Owned For
Owner Type
Purchase Details
Closed on
Mar 4, 2011
Sold by
Ramirez Zoraida
Bought by
Ramirez Adelson Javier
Current Estimated Value
Purchase Details
Closed on
Dec 13, 2010
Sold by
Fannie Mae
Bought by
Ramirez Zoraida
Purchase Details
Closed on
Aug 17, 2010
Sold by
Telfort Pierre L
Bought by
Federal National Mortgage Association
Purchase Details
Closed on
Nov 28, 2005
Sold by
Americas First Home Of Southwest Fl Llp
Bought by
Telfort Pierre
Home Financials for this Owner
Home Financials are based on the most recent Mortgage that was taken out on this home.
Original Mortgage
$191,808
Interest Rate
6.04%
Mortgage Type
Fannie Mae Freddie Mac
Purchase Details
Closed on
Sep 1, 2004
Sold by
Pacheco Anna
Bought by
Americas First Home Of Southwest Fl Llp
Purchase Details
Closed on
Aug 24, 2004
Sold by
Ferro Thomas
Bought by
Americas First Home Of Southwest Fl Llp
Create a Home Valuation Report for This Property
The Home Valuation Report is an in-depth analysis detailing your home's value as well as a comparison with similar homes in the area
Home Values in the Area
Average Home Value in this Area
Purchase History
| Date | Buyer | Sale Price | Title Company |
|---|---|---|---|
| Ramirez Adelson Javier | -- | None Available | |
| Ramirez Zoraida | $99,900 | Title & Abstract Agency Of A | |
| Federal National Mortgage Association | $81,200 | None Available | |
| Telfort Pierre | $202,100 | Cape Coral Title Insurance A | |
| Americas First Home Of Southwest Fl Llp | $15,000 | Cape Coral Title Insurance A | |
| Americas First Home Of Southwest Fl Llp | $15,000 | Cape Coral Title Insurance A |
Source: Public Records
Mortgage History
| Date | Status | Borrower | Loan Amount |
|---|---|---|---|
| Previous Owner | Telfort Pierre | $191,808 |
Source: Public Records
Tax History Compared to Growth
Tax History
| Year | Tax Paid | Tax Assessment Tax Assessment Total Assessment is a certain percentage of the fair market value that is determined by local assessors to be the total taxable value of land and additions on the property. | Land | Improvement |
|---|---|---|---|---|
| 2025 | $5,987 | $262,533 | $69,445 | $185,728 |
| 2024 | $5,890 | $260,339 | -- | -- |
| 2023 | $5,890 | $236,672 | $0 | $0 |
| 2022 | $5,399 | $215,156 | $0 | $0 |
| 2021 | $4,948 | $195,596 | $38,032 | $157,564 |
| 2020 | $4,691 | $177,654 | $28,000 | $149,654 |
| 2019 | $4,514 | $168,773 | $28,600 | $140,173 |
| 2018 | $4,579 | $168,766 | $27,300 | $141,466 |
| 2017 | $4,448 | $159,074 | $16,000 | $143,074 |
| 2016 | $4,319 | $148,066 | $16,000 | $132,066 |
| 2015 | $3,266 | $135,588 | $11,200 | $124,388 |
| 2014 | -- | $119,403 | $6,600 | $112,803 |
| 2013 | -- | $105,699 | $4,200 | $101,499 |
Source: Public Records
Map
Nearby Homes
- 2703 SW 2nd Ave
- 2704 SW 2nd Place
- 2712 SW 2nd Place
- 2716 SW 2nd Place
- 204 SW 28th St
- 2614 SW Santa Barbara Place
- 129 SW 28th Terrace
- 227 SW 28th Terrace
- 234 SW 26th St
- 2804 Santa Barbara Blvd
- 5214 SW 2nd Ave
- 2701 SW 4th Ave
- 2705 SW 4th Ave
- 113 SE 28th Terrace
- 125 SE 27th Terrace
- 406 SW 28th St
- 2714 SW 4th Ave
- 322 SW 28th Terrace
- 2919/2921 SW Santa Barbara Place
- 314 SW 29th St
- 2621 SW 2nd Ave
- 2626 SW 1st Place
- 2622 SW 1st Place
- 2704 SW 1st Place Unit 45
- 2617 SW 2nd Ave
- 2707 SW 2nd Ave
- 2626 SW 2nd Ave
- 2622 SW 2nd Ave
- 2708 SW 1st Place
- 2618 SW 1st Place
- 2618 SW 2nd Ave
- 2613 SW 2nd Ave
- 2711 SW 2nd Ave
- 2708 SW 2nd Ave
- 2614 SW 1st Place
- 2712 SW 1st Place
- 2712 SW 2nd Ave Unit 45
- 2631 SW 2nd Place
- 2625 SW 1st Place
- 2621 SW 1st Place