Estimated Value: $371,000 - $396,000
4
Beds
2
Baths
1,900
Sq Ft
$202/Sq Ft
Est. Value
About This Home
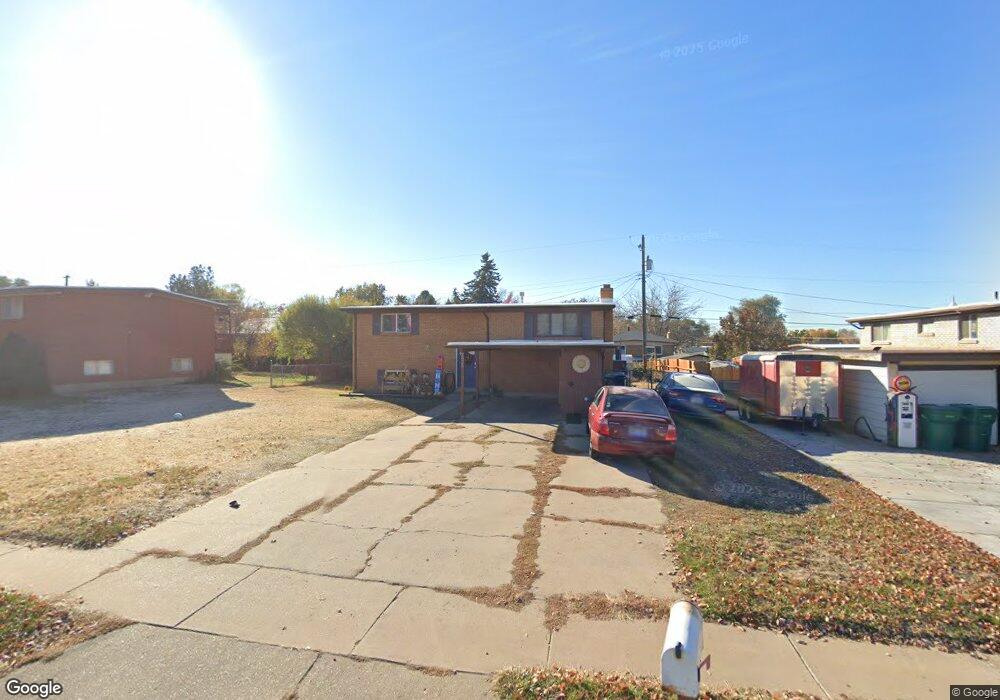
This home is located at 2625 W 5725 S, Roy, UT 84067 and is currently estimated at $383,242, approximately $201 per square foot. 2625 W 5725 S is a home located in Weber County with nearby schools including Roy Elementary School, Roy Junior High School, and Roy High School.
Ownership History
Date
Name
Owned For
Owner Type
Purchase Details
Closed on
Aug 19, 2021
Sold by
Richards Doris M
Bought by
Richards Doris M and Austin Brittney
Current Estimated Value
Home Financials for this Owner
Home Financials are based on the most recent Mortgage that was taken out on this home.
Original Mortgage
$252,000
Outstanding Balance
$229,146
Interest Rate
2.9%
Mortgage Type
New Conventional
Estimated Equity
$154,096
Purchase Details
Closed on
Aug 13, 2021
Sold by
Schiers Noah and Schiers Robert D
Bought by
Richards Doris M
Home Financials for this Owner
Home Financials are based on the most recent Mortgage that was taken out on this home.
Original Mortgage
$252,000
Outstanding Balance
$229,146
Interest Rate
2.9%
Mortgage Type
New Conventional
Estimated Equity
$154,096
Purchase Details
Closed on
Mar 9, 2018
Sold by
Cooper Helen L
Bought by
Schiers Noah and Schiers Robert D
Home Financials for this Owner
Home Financials are based on the most recent Mortgage that was taken out on this home.
Original Mortgage
$179,685
Interest Rate
4.37%
Mortgage Type
FHA
Create a Home Valuation Report for This Property
The Home Valuation Report is an in-depth analysis detailing your home's value as well as a comparison with similar homes in the area
Home Values in the Area
Average Home Value in this Area
Purchase History
| Date | Buyer | Sale Price | Title Company |
|---|---|---|---|
| Richards Doris M | -- | North Star Title Co | |
| Richards Doris M | -- | Stewart Title Insurance Agcy | |
| Schiers Noah | -- | Stewart Title Ins Agency |
Source: Public Records
Mortgage History
| Date | Status | Borrower | Loan Amount |
|---|---|---|---|
| Open | Richards Doris M | $252,000 | |
| Previous Owner | Schiers Noah | $179,685 |
Source: Public Records
Tax History Compared to Growth
Tax History
| Year | Tax Paid | Tax Assessment Tax Assessment Total Assessment is a certain percentage of the fair market value that is determined by local assessors to be the total taxable value of land and additions on the property. | Land | Improvement |
|---|---|---|---|---|
| 2025 | $2,400 | $376,526 | $110,000 | $266,526 |
| 2024 | $2,319 | $201,299 | $60,509 | $140,790 |
| 2023 | $2,116 | $182,600 | $57,745 | $124,855 |
| 2022 | $2,341 | $210,650 | $55,008 | $155,642 |
| 2021 | $1,780 | $260,000 | $65,022 | $194,978 |
| 2020 | $1,643 | $220,000 | $65,022 | $154,978 |
| 2019 | $1,540 | $193,000 | $40,002 | $152,998 |
| 2018 | $1,389 | $162,000 | $35,083 | $126,917 |
| 2017 | $1,337 | $146,000 | $35,083 | $110,917 |
| 2016 | $1,239 | $72,196 | $19,237 | $52,959 |
| 2015 | $1,153 | $68,458 | $21,944 | $46,514 |
| 2014 | $1,162 | $68,459 | $16,499 | $51,960 |
Source: Public Records
Map
Nearby Homes
- 2571 W 5725 S
- 2587 W 5750 S
- 2672 W 5750 S
- 5810 S 2550 W
- 2646 W 5625 S Unit M-2646
- 2829 W 5925 S
- 2778 W 5550 S Unit 28
- 2786 W 5550 S Unit C11
- 2907 W 5775 S
- 5643 S 2200 W
- 5317 S 2690 W
- 484 W 2650 N
- 480 W 2650 N
- 5326 S 2675 W
- 2635 N 500 W Unit 45
- 5345 S 2425 W
- 2612 N 525 W
- 5573 S 2150 W
- 428 W 2650 N
- 2593 N 500 W Unit 56
- 2617 W 5725 S
- 2637 W 5725 S
- 2636 W 5750 S
- 2626 W 5750 S Unit 2
- 2603 W 5725 S
- 2616 W 5725 S
- 2646 W 5750 S
- 2622 W 5750 S
- 2632 W 5725 S
- 2642 W 5725 S
- 2649 W 5725 S
- 2595 W 5725 S
- 2668 W 5750 S
- 5715 S 2600 W
- 2648 W 5750 S
- 2618 W 5750 S
- 2648-1 W 5750 S Unit 2648 W 5750 S Unit 1
- 2648-1 W 5750 S
- 5720 S 2600 W
- 2661 W 5725 S