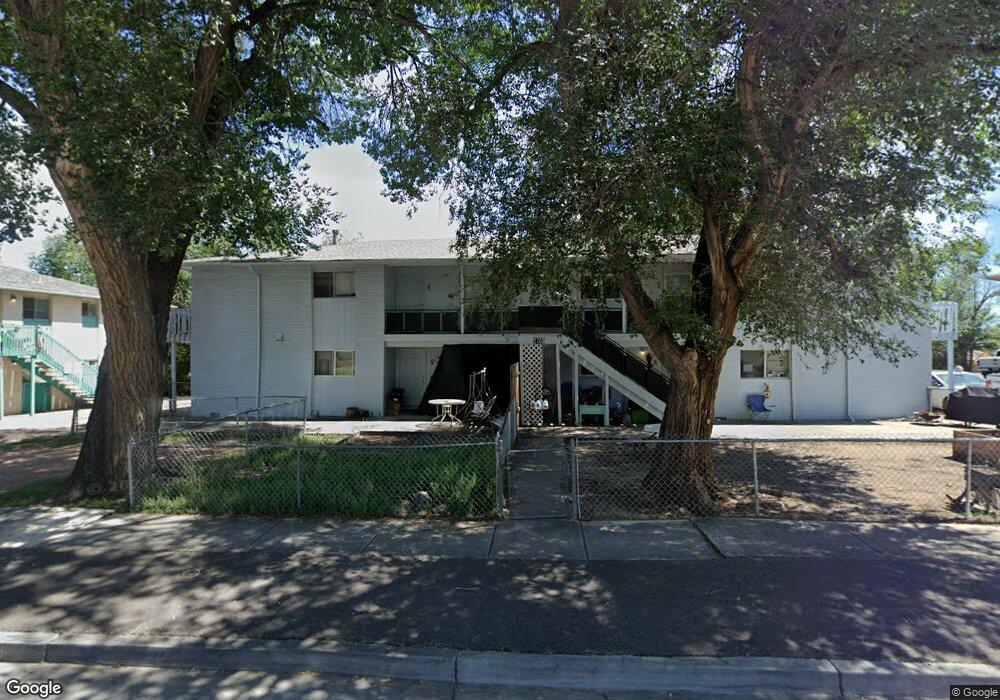
2626 Cooper Ave Colorado Springs, CO 80907
The Mesa NeighborhoodEstimated Value: $374,495 - $428,000
4
Beds
2
Baths
1,050
Sq Ft
$381/Sq Ft
Est. Value
About This Home
This home is located at 2626 Cooper Ave, Colorado Springs, CO 80907 and is currently estimated at $400,124, approximately $381 per square foot. 2626 Cooper Ave is a home located in El Paso County with nearby schools including Jackson Elementary School, Holmes Middle School, and Coronado High School.
Ownership History
Date
Name
Owned For
Owner Type
Purchase Details
Closed on
Jun 16, 2005
Sold by
Tuggle Ricky Lee
Bought by
Tuggle Ricky Lee and Tuggle Theresa
Current Estimated Value
Home Financials for this Owner
Home Financials are based on the most recent Mortgage that was taken out on this home.
Original Mortgage
$140,165
Outstanding Balance
$81,764
Interest Rate
7.85%
Mortgage Type
Fannie Mae Freddie Mac
Estimated Equity
$318,360
Purchase Details
Closed on
Apr 22, 2005
Sold by
Lamb Charlotte A
Bought by
Tuggle Ricky Lee
Home Financials for this Owner
Home Financials are based on the most recent Mortgage that was taken out on this home.
Original Mortgage
$140,165
Outstanding Balance
$81,764
Interest Rate
7.85%
Mortgage Type
Fannie Mae Freddie Mac
Estimated Equity
$318,360
Purchase Details
Closed on
Jul 16, 1996
Sold by
Lamb Gordon E
Bought by
Lamb Charlotte A
Purchase Details
Closed on
Sep 20, 1990
Bought by
Tuggle Theresa
Purchase Details
Closed on
Jun 1, 1979
Bought by
Tuggle Theresa
Create a Home Valuation Report for This Property
The Home Valuation Report is an in-depth analysis detailing your home's value as well as a comparison with similar homes in the area
Home Values in the Area
Average Home Value in this Area
Purchase History
| Date | Buyer | Sale Price | Title Company |
|---|---|---|---|
| Tuggle Ricky Lee | -- | -- | |
| Tuggle Ricky Lee | $164,900 | Title America | |
| Lamb Charlotte A | -- | -- | |
| Tuggle Theresa | $54,000 | -- | |
| Tuggle Theresa | -- | -- |
Source: Public Records
Mortgage History
| Date | Status | Borrower | Loan Amount |
|---|---|---|---|
| Open | Tuggle Ricky Lee | $140,165 |
Source: Public Records
Tax History Compared to Growth
Tax History
| Year | Tax Paid | Tax Assessment Tax Assessment Total Assessment is a certain percentage of the fair market value that is determined by local assessors to be the total taxable value of land and additions on the property. | Land | Improvement |
|---|---|---|---|---|
| 2025 | $1,220 | $27,270 | -- | -- |
| 2024 | $1,109 | $26,360 | $4,290 | $22,070 |
| 2022 | $998 | $17,830 | $2,970 | $14,860 |
| 2021 | $1,083 | $18,350 | $3,060 | $15,290 |
| 2020 | $1,049 | $15,460 | $2,600 | $12,860 |
| 2019 | $1,044 | $15,460 | $2,600 | $12,860 |
| 2018 | $902 | $12,290 | $2,400 | $9,890 |
| 2017 | $854 | $12,290 | $2,400 | $9,890 |
| 2016 | $670 | $11,560 | $2,650 | $8,910 |
| 2015 | $668 | $11,560 | $2,650 | $8,910 |
| 2014 | $676 | $11,230 | $2,390 | $8,840 |
Source: Public Records
Map
Nearby Homes
- 2706 N Chestnut St
- 635 Prestonwood Dr
- 842 Mesa Valley Rd Unit 842
- 415 W Van Buren St
- 2637 Mesa Springs View
- 2552 Mesa Springs View
- 701 Little Bear Grove
- 711 Little Bear Grove
- 721 Little Bear Grove
- 2408 N 7th St Unit A
- 731 Little Bear Grove
- 2906 N Chestnut St
- 747 Belleza View
- 741 Belleza View
- 741 Little Bear Grove
- 735 Belleza View
- 729 Belleza View
- 723 Belleza View
- 751 Little Bear Grove
- 717 Belleza View
- 2622 Cooper Ave
- 2630 Cooper Ave
- 2703 N Chestnut St
- 2618 Cooper Ave
- 2634 Cooper Ave
- 2625 N Chestnut St
- 2707 N Chestnut St
- 2707 N Chestnut St Unit 3
- 2623 Cooper Ave
- 2614 Cooper Ave
- 2638 Cooper Ave
- 2617 N Chestnut St
- 2613 Cooper Ave
- 2628 Green Ridge Dr
- 2610 Cooper Ave
- 2624 Green Ridge Dr
- 2702 N Chestnut St
- 2710 N Chestnut St
- 2640 Cooper Ave
- 2738 Green Ridge Dr