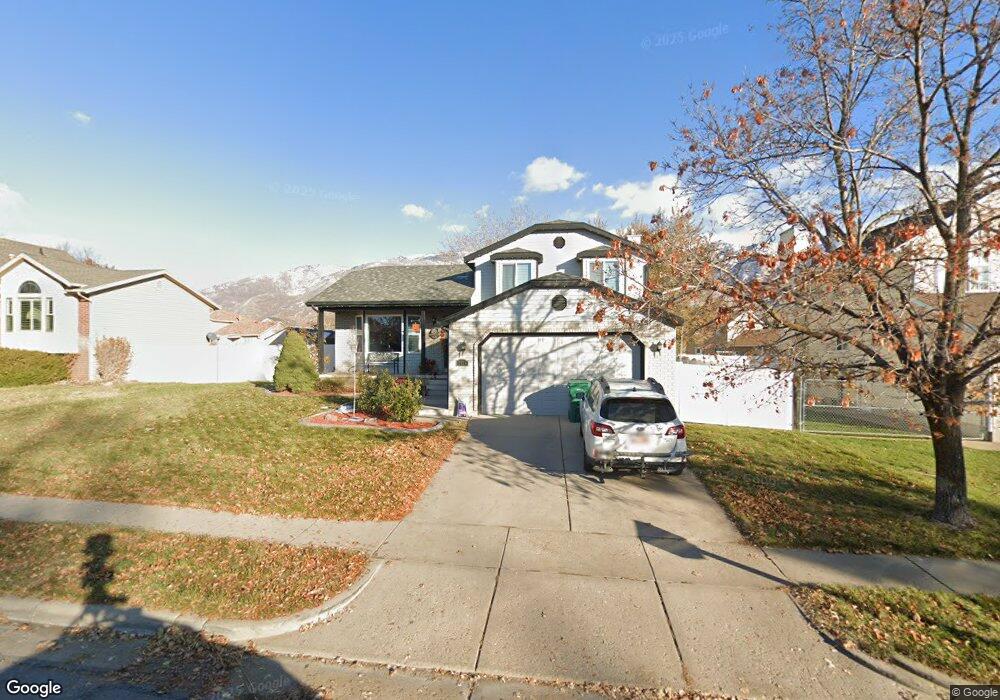
2626 N 1650 E Layton, UT 84040
Estimated Value: $512,000 - $525,576
4
Beds
4
Baths
2,444
Sq Ft
$212/Sq Ft
Est. Value
About This Home
This home is located at 2626 N 1650 E, Layton, UT 84040 and is currently estimated at $518,144, approximately $212 per square foot. 2626 N 1650 E is a home located in Davis County with nearby schools including Mountain View Elementary School, North Layton Junior High School, and Northridge High School.
Ownership History
Date
Name
Owned For
Owner Type
Purchase Details
Closed on
Sep 19, 2013
Sold by
Watson Sims L and Watson Marilyn H
Bought by
Watson Marilyn H
Current Estimated Value
Purchase Details
Closed on
Jul 16, 1998
Sold by
Krebs Tamara J
Bought by
Watson Sims L and Watson Marilyn H
Home Financials for this Owner
Home Financials are based on the most recent Mortgage that was taken out on this home.
Original Mortgage
$139,740
Outstanding Balance
$27,834
Interest Rate
7%
Mortgage Type
VA
Estimated Equity
$490,310
Purchase Details
Closed on
Jul 17, 1997
Sold by
Krebs Brian E
Bought by
Krebs Tamara J
Create a Home Valuation Report for This Property
The Home Valuation Report is an in-depth analysis detailing your home's value as well as a comparison with similar homes in the area
Home Values in the Area
Average Home Value in this Area
Purchase History
| Date | Buyer | Sale Price | Title Company |
|---|---|---|---|
| Watson Marilyn H | -- | First American Title | |
| Watson Marilyn H | -- | First American Title | |
| Watson Sims L | -- | U S Title | |
| Krebs Tamara J | -- | -- |
Source: Public Records
Mortgage History
| Date | Status | Borrower | Loan Amount |
|---|---|---|---|
| Open | Watson Sims L | $139,740 |
Source: Public Records
Tax History
| Year | Tax Paid | Tax Assessment Tax Assessment Total Assessment is a certain percentage of the fair market value that is determined by local assessors to be the total taxable value of land and additions on the property. | Land | Improvement |
|---|---|---|---|---|
| 2025 | $2,728 | $261,800 | $109,164 | $152,636 |
| 2024 | $2,597 | $253,000 | $135,400 | $117,600 |
| 2023 | $2,542 | $441,000 | $188,369 | $252,631 |
| 2022 | $2,637 | $250,251 | $100,524 | $149,727 |
| 2021 | $2,440 | $345,000 | $152,165 | $192,835 |
| 2020 | $2,162 | $292,000 | $119,993 | $172,007 |
| 2019 | $2,109 | $281,000 | $107,878 | $173,122 |
| 2018 | $1,908 | $255,000 | $64,509 | $190,491 |
| 2016 | $1,723 | $120,945 | $32,937 | $88,008 |
| 2015 | $1,637 | $109,615 | $32,937 | $76,678 |
| 2014 | $1,536 | $105,736 | $32,937 | $72,799 |
| 2013 | -- | $102,024 | $22,748 | $79,276 |
Source: Public Records
Map
Nearby Homes
- 3142 E Thorley Dr
- 3138 E Thorley Dr
- 2826 N 1600 E
- 1731 E 2825 N
- 1785 E 2825 N
- 1447 E 2700 N
- 1911 Deere Valley Dr
- 1935 Deere Valley Dr
- 1444 E 2400 N
- 1821 E Whitetail Way
- 2273 N 1975 E
- 2340 N 2050 E
- 2189 N 1950 E
- 1827 E Whitetail Dr
- 2096 N 1450 E
- 3176 N 1450 E
- 2597 N 2300 E
- 1241 E 3075 N
- 2315 N 1075 E
- 1266 E 3125 N
Your Personal Tour Guide
Ask me questions while you tour the home.