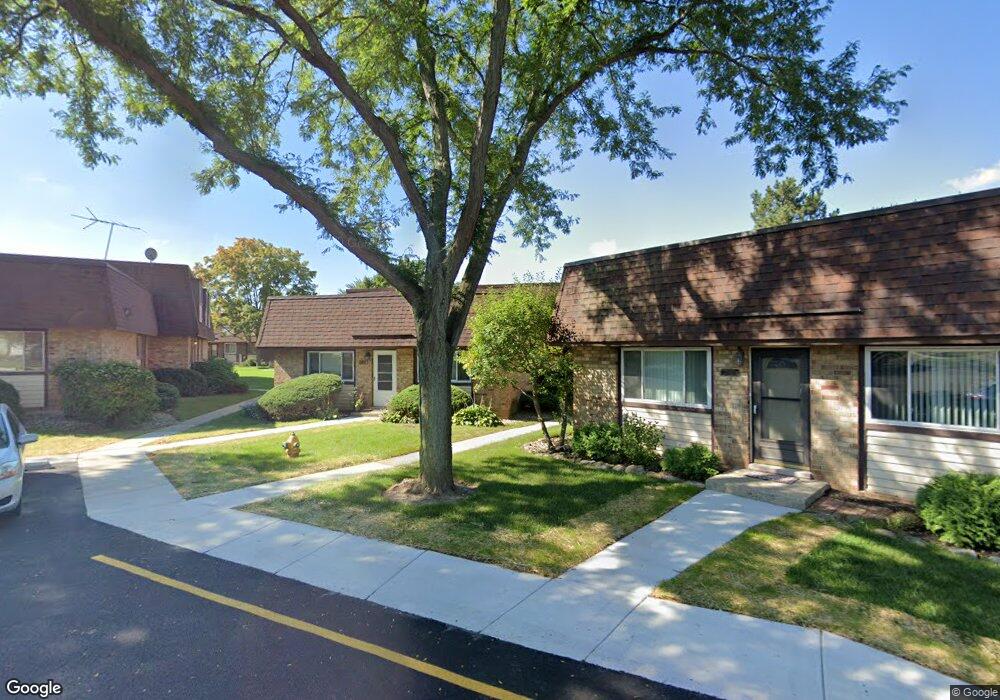
2626 Woodview Ct Unit 114 Waukegan, IL 60087
The Links at Midlane NeighborhoodEstimated Value: $149,835 - $169,000
--
Bed
1
Bath
920
Sq Ft
$176/Sq Ft
Est. Value
About This Home
This home is located at 2626 Woodview Ct Unit 114, Waukegan, IL 60087 and is currently estimated at $161,709, approximately $175 per square foot. 2626 Woodview Ct Unit 114 is a home located in Lake County with nearby schools including Spaulding Elementary School, Viking Middle School, and Warren Township High School.
Ownership History
Date
Name
Owned For
Owner Type
Purchase Details
Closed on
Oct 1, 2002
Sold by
Gonzalez Oscar
Bought by
Hill Catherine
Current Estimated Value
Home Financials for this Owner
Home Financials are based on the most recent Mortgage that was taken out on this home.
Original Mortgage
$69,500
Interest Rate
6.24%
Mortgage Type
Purchase Money Mortgage
Purchase Details
Closed on
Aug 7, 2002
Sold by
Gonzalez Oscar and Gonzalez Ruth
Bought by
Gonzalez Oscar
Home Financials for this Owner
Home Financials are based on the most recent Mortgage that was taken out on this home.
Original Mortgage
$69,500
Interest Rate
6.24%
Mortgage Type
Purchase Money Mortgage
Purchase Details
Closed on
Dec 1, 1999
Sold by
Walker Jeanetta L
Bought by
Gonzalez Oscar and Gonzalez Ruth E
Home Financials for this Owner
Home Financials are based on the most recent Mortgage that was taken out on this home.
Original Mortgage
$75,500
Interest Rate
8.02%
Mortgage Type
Purchase Money Mortgage
Create a Home Valuation Report for This Property
The Home Valuation Report is an in-depth analysis detailing your home's value as well as a comparison with similar homes in the area
Home Values in the Area
Average Home Value in this Area
Purchase History
| Date | Buyer | Sale Price | Title Company |
|---|---|---|---|
| Hill Catherine | $89,500 | First American Title | |
| Gonzalez Oscar | -- | -- | |
| Gonzalez Oscar | $78,000 | -- |
Source: Public Records
Mortgage History
| Date | Status | Borrower | Loan Amount |
|---|---|---|---|
| Closed | Hill Catherine | $69,500 | |
| Previous Owner | Gonzalez Oscar | $75,500 |
Source: Public Records
Tax History Compared to Growth
Tax History
| Year | Tax Paid | Tax Assessment Tax Assessment Total Assessment is a certain percentage of the fair market value that is determined by local assessors to be the total taxable value of land and additions on the property. | Land | Improvement |
|---|---|---|---|---|
| 2024 | $4,162 | $38,393 | $5,964 | $32,429 |
| 2023 | $3,178 | $34,274 | $5,324 | $28,950 |
| 2022 | $3,178 | $26,122 | $5,738 | $20,384 |
| 2021 | $2,605 | $21,995 | $4,832 | $17,163 |
| 2020 | $2,563 | $21,454 | $4,713 | $16,741 |
| 2019 | $2,532 | $20,831 | $4,576 | $16,255 |
| 2018 | $1,711 | $13,820 | $3,426 | $10,394 |
| 2017 | $1,709 | $13,424 | $3,328 | $10,096 |
| 2016 | $1,654 | $12,826 | $3,180 | $9,646 |
| 2015 | $1,637 | $12,920 | $3,016 | $9,904 |
| 2014 | $1,368 | $9,981 | $2,974 | $7,007 |
| 2012 | $797 | $13,540 | $2,998 | $10,542 |
Source: Public Records
Map
Nearby Homes
- 2634 Woodview Ct Unit 5
- 2670 Woodview Ct Unit 1
- 37114 N Shirley Dr
- 0 Ryan Rd
- 13360 W Blanchard Rd
- 3015 Monterey Ln
- 3050 Nicklaus Ln
- 3077 Nicklaus Ln Unit 4
- 4605 Sawgrass Blvd Unit 1202
- 3068 N Southern Hills Dr
- 3148 Concord Ln
- 4171 Midlane Dr
- 4827 W Pebble Beach Dr
- 4150 Midlane Dr
- 12535 W Blanchard Rd
- 36245 N Green Bay Rd
- 38148 N Helena Ln
- 36396 N Skokie Hwy
- 12933 W Polo Ave
- 3267 Hampshire Ln
- 2664 Woodview Ct
- 2666 Woodview Ct Unit 4
- 2668 Woodview Ct Unit 3
- 2656 Woodview Ct Unit 4
- 2658 Woodview Ct Unit 3
- 2652 Woodview Ct Unit 2
- 2644 Woodview Ct Unit 5
- 2648 Woodview Ct Unit 3
- 2642 Woodview Ct Unit 2
- 2632 Woodview Ct Unit 2
- 2624 Woodview Ct Unit 5
- 2614 Woodview Ct
- 2618 Woodview Ct Unit 3
- 2612 Woodview Ct Unit 210
- 2604 Woodview Ct Unit 5
- 2616 Woodview Ct Unit 4
- 2674 Woodview Ct Unit 5
- 2676 Woodview Ct Unit 4
- 2678 Woodview Ct Unit 3
- 2672 Woodview Ct Unit 162