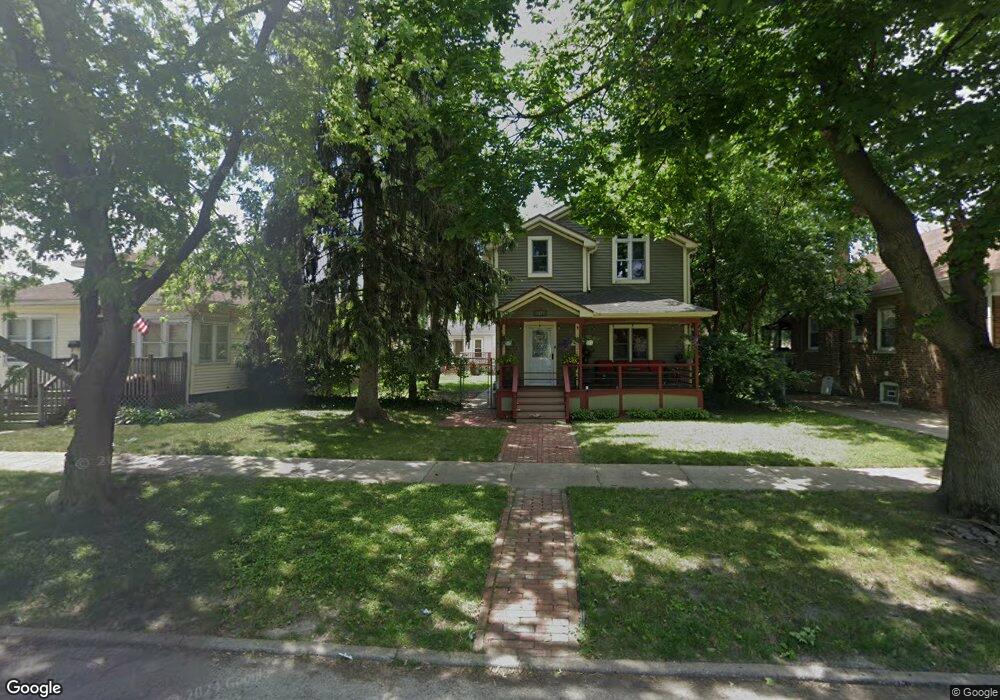
2627 122nd St Blue Island, IL 60406
Estimated Value: $235,000 - $303,000
3
Beds
2
Baths
1,016
Sq Ft
$257/Sq Ft
Est. Value
About This Home
This home is located at 2627 122nd St, Blue Island, IL 60406 and is currently estimated at $261,289, approximately $257 per square foot. 2627 122nd St is a home located in Cook County with nearby schools including Paul Revere Primary School, Paul Revere Intermediate School, and Veterans Memorial Middle School.
Ownership History
Date
Name
Owned For
Owner Type
Purchase Details
Closed on
Jun 19, 2018
Sold by
Roe Thomas J and Roe Bonnie
Bought by
Sianez Luis and Sianez Gloria
Current Estimated Value
Home Financials for this Owner
Home Financials are based on the most recent Mortgage that was taken out on this home.
Original Mortgage
$222,888
Outstanding Balance
$195,891
Interest Rate
5.25%
Mortgage Type
FHA
Estimated Equity
$65,398
Purchase Details
Closed on
Oct 20, 2004
Sold by
Hachmon Foreclosures Inc
Bought by
Roe Thomas J and Roe Bonnie
Purchase Details
Closed on
Jan 26, 2004
Sold by
Downes
Bought by
Hachmon Foreclosures Inc
Purchase Details
Closed on
Jan 27, 1995
Sold by
Orsolini Giovanna
Bought by
Downes Thomas A and Molina Downes Angela A
Home Financials for this Owner
Home Financials are based on the most recent Mortgage that was taken out on this home.
Original Mortgage
$66,500
Interest Rate
9.21%
Create a Home Valuation Report for This Property
The Home Valuation Report is an in-depth analysis detailing your home's value as well as a comparison with similar homes in the area
Home Values in the Area
Average Home Value in this Area
Purchase History
| Date | Buyer | Sale Price | Title Company |
|---|---|---|---|
| Sianez Luis | $227,000 | Fidelity National Title | |
| Roe Thomas J | $60,000 | 1St American Title | |
| Hachmon Foreclosures Inc | $73,000 | 1St American Title | |
| Downes Thomas A | $70,000 | -- |
Source: Public Records
Mortgage History
| Date | Status | Borrower | Loan Amount |
|---|---|---|---|
| Open | Sianez Luis | $222,888 | |
| Previous Owner | Downes Thomas A | $66,500 |
Source: Public Records
Tax History Compared to Growth
Tax History
| Year | Tax Paid | Tax Assessment Tax Assessment Total Assessment is a certain percentage of the fair market value that is determined by local assessors to be the total taxable value of land and additions on the property. | Land | Improvement |
|---|---|---|---|---|
| 2024 | $7,663 | $23,000 | $4,492 | $18,508 |
| 2023 | $5,217 | $23,000 | $4,492 | $18,508 |
| 2022 | $5,217 | $14,347 | $3,906 | $10,441 |
| 2021 | $4,961 | $14,347 | $3,906 | $10,441 |
| 2020 | $4,925 | $14,347 | $3,906 | $10,441 |
| 2019 | $4,192 | $12,734 | $3,515 | $9,219 |
| 2018 | $4,004 | $12,734 | $3,515 | $9,219 |
| 2017 | $4,081 | $12,734 | $3,515 | $9,219 |
| 2016 | $3,994 | $11,243 | $2,929 | $8,314 |
| 2015 | $3,830 | $11,243 | $2,929 | $8,314 |
| 2014 | $3,781 | $11,243 | $2,929 | $8,314 |
| 2013 | $3,772 | $11,958 | $2,929 | $9,029 |
Source: Public Records
Map
Nearby Homes
- 12200 Highland Ave
- 2636 121st Place
- 2610 Grunewald St
- 2630 Grunewald St
- 12250 Greenwood Ave
- 12235 Fairway Cir Unit A
- 12045 Greenwood Ave
- 2529 Collins St
- 2528 Cochran St
- 12452 Fairview Ave
- 2330 121st St
- 12456 Fairview Ave
- 11900 Ann St
- 2521 Lewis St
- 12547 Greenwood Ave
- 12544 Fairview Ave Unit 2G
- 12552 Highland Ave
- 12546 Fairview Ave Unit 3D
- 12548 Fairview Ave Unit BLDG1
- 12548 Fairview Ave Unit 2B
- 2627 122nd Place
- 2619 122nd Place
- 2629 122nd Place
- 2629 122nd Place
- 2633 122nd Place
- 2639 122nd Place
- 2628 123rd St
- 2620 123rd St
- 2620 123rd St
- 2616 123rd St
- 2624 122nd Place
- 12238 Maple Ave
- 2624 122nd St
- 12234 Maple Ave
- 2614 122nd Place
- 2618 122nd Place
- 2618 122nd Place
- 2614 122nd St
- 12246 Maple Ave
- 12246 Maple Ave