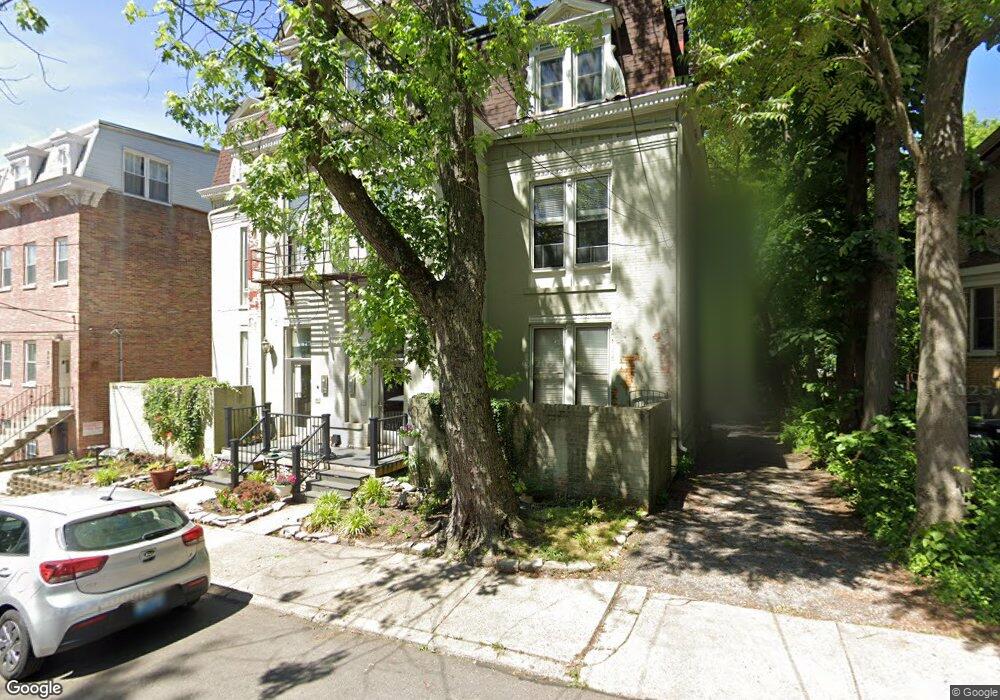
2627 Cleinview Ave Unit 3 Cincinnati, OH 45206
East Walnut Hills NeighborhoodEstimated Value: $157,000 - $212,000
2
Beds
1
Bath
1,009
Sq Ft
$188/Sq Ft
Est. Value
About This Home
This home is located at 2627 Cleinview Ave Unit 3, Cincinnati, OH 45206 and is currently estimated at $189,290, approximately $187 per square foot. 2627 Cleinview Ave Unit 3 is a home located in Hamilton County with nearby schools including Frederick Douglass Elementary School, Clark Montessori High School, and Robert A. Taft Information Technology High School.
Ownership History
Date
Name
Owned For
Owner Type
Purchase Details
Closed on
Oct 28, 2005
Sold by
Tepe Charles E and Scarborough Connie L
Bought by
Montas Indira
Current Estimated Value
Home Financials for this Owner
Home Financials are based on the most recent Mortgage that was taken out on this home.
Original Mortgage
$99,500
Outstanding Balance
$65,869
Interest Rate
9.7%
Mortgage Type
Fannie Mae Freddie Mac
Estimated Equity
$123,421
Purchase Details
Closed on
Jul 17, 2003
Sold by
Hackney Brian S
Bought by
Tepe Charles E and Scarborough Connie L
Home Financials for this Owner
Home Financials are based on the most recent Mortgage that was taken out on this home.
Original Mortgage
$68,000
Interest Rate
5.3%
Mortgage Type
Unknown
Purchase Details
Closed on
Mar 11, 2002
Sold by
Fovel Peter F and Fovel Amy
Bought by
Hackney Brian S
Home Financials for this Owner
Home Financials are based on the most recent Mortgage that was taken out on this home.
Original Mortgage
$72,000
Interest Rate
5.5%
Create a Home Valuation Report for This Property
The Home Valuation Report is an in-depth analysis detailing your home's value as well as a comparison with similar homes in the area
Home Values in the Area
Average Home Value in this Area
Purchase History
| Date | Buyer | Sale Price | Title Company |
|---|---|---|---|
| Montas Indira | $99,500 | None Available | |
| Tepe Charles E | $85,000 | C&R Title Agency Inc | |
| Hackney Brian S | $80,000 | Tri-Star Title Agency Inc |
Source: Public Records
Mortgage History
| Date | Status | Borrower | Loan Amount |
|---|---|---|---|
| Open | Montas Indira | $99,500 | |
| Previous Owner | Tepe Charles E | $68,000 | |
| Previous Owner | Hackney Brian S | $72,000 |
Source: Public Records
Tax History Compared to Growth
Tax History
| Year | Tax Paid | Tax Assessment Tax Assessment Total Assessment is a certain percentage of the fair market value that is determined by local assessors to be the total taxable value of land and additions on the property. | Land | Improvement |
|---|---|---|---|---|
| 2024 | $3,191 | $53,498 | $7,000 | $46,498 |
| 2023 | $3,263 | $53,498 | $7,000 | $46,498 |
| 2022 | $3,012 | $44,300 | $6,146 | $38,154 |
| 2021 | $2,900 | $44,300 | $6,146 | $38,154 |
| 2020 | $2,983 | $44,300 | $6,146 | $38,154 |
| 2019 | $2,476 | $33,558 | $4,655 | $28,903 |
| 2018 | $2,480 | $33,558 | $4,655 | $28,903 |
| 2017 | $2,356 | $33,558 | $4,655 | $28,903 |
| 2016 | $2,129 | $29,894 | $4,655 | $25,239 |
| 2015 | $1,919 | $29,894 | $4,655 | $25,239 |
| 2014 | $1,933 | $29,894 | $4,655 | $25,239 |
| 2013 | $1,967 | $29,894 | $4,655 | $25,239 |
Source: Public Records
Map
Nearby Homes
- 2625 Cleinview Ave
- 2600 Cleinview Ave
- 1715 Wm H Taft Rd
- 2621 Hackberry St
- 2548 Hackberry St
- 1635 Clayton St
- 2731 Cleinview Ave Unit 2
- 2731 Cleinview Ave
- 2740 Cleinview Ave
- 1770 E Mcmillan St Unit 2
- 3031 Hackberry St
- 1783 E Mcmillan St
- 1775 E Mcmillan St
- 1520 William Howard Taft Rd
- 2549 Ingleside Ave
- 1815 Wm H Taft Rd
- 1627 E Mcmillan St
- 1382 Burdette Ave
- 2606 Hackberry St
- 2627 Cleinview Ave Unit 5
- 2627 Cleinview Ave Unit 1
- 2627 Cleinview Ave
- 2625 Cleinview Ave Unit 6
- 2625 Cleinview Ave Unit 2
- 2625 Cleinview Ave Unit 4
- 2625 Cleinview Ave Unit 5
- 2617 Cleinview Ave Unit 2
- 2617 Cleinview Ave
- 1716 William Howard Taft Rd
- 2629 Cleinview Ave
- 2631 Cleinview Ave
- 2633 Cleinview Ave
- 1709 Pomona Ct
- 1722 William Howard Taft Rd
- 1714 Wm H Taft Rd
- 1714 William Howard Taft Rd
- 1712 Wm H Taft Rd
- 1712 Wm H Taft Rd Unit 2
- 1712 William Howard Taft Rd